Approfondite la conoscenza dei vostri dati.
Grapher è un ottimo software tecnico di grafica scientifica per chiunque abbia necessità di creare grafici di grande qualità velocemente e facilmente.
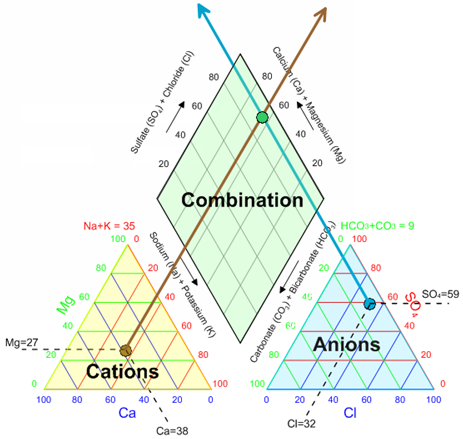
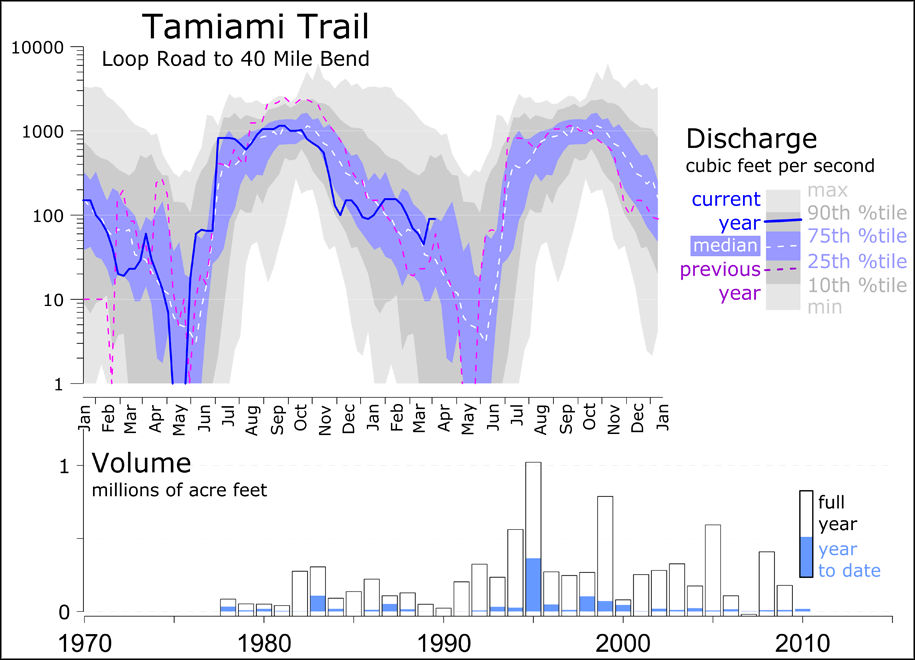
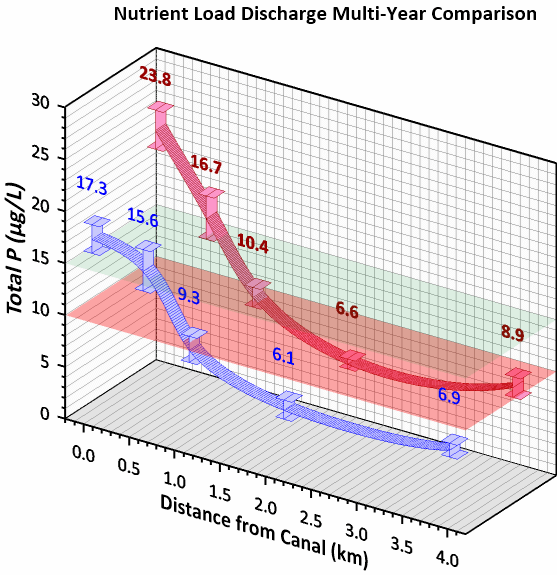
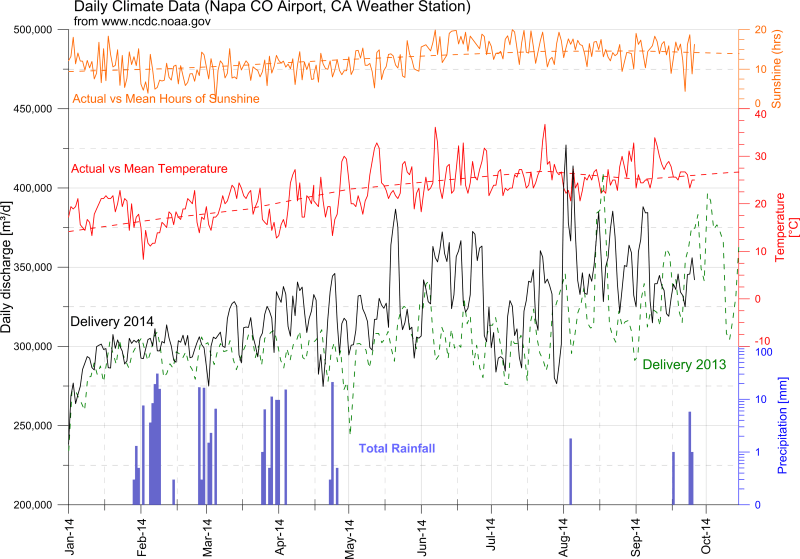
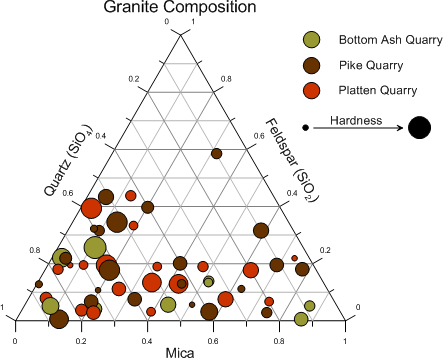
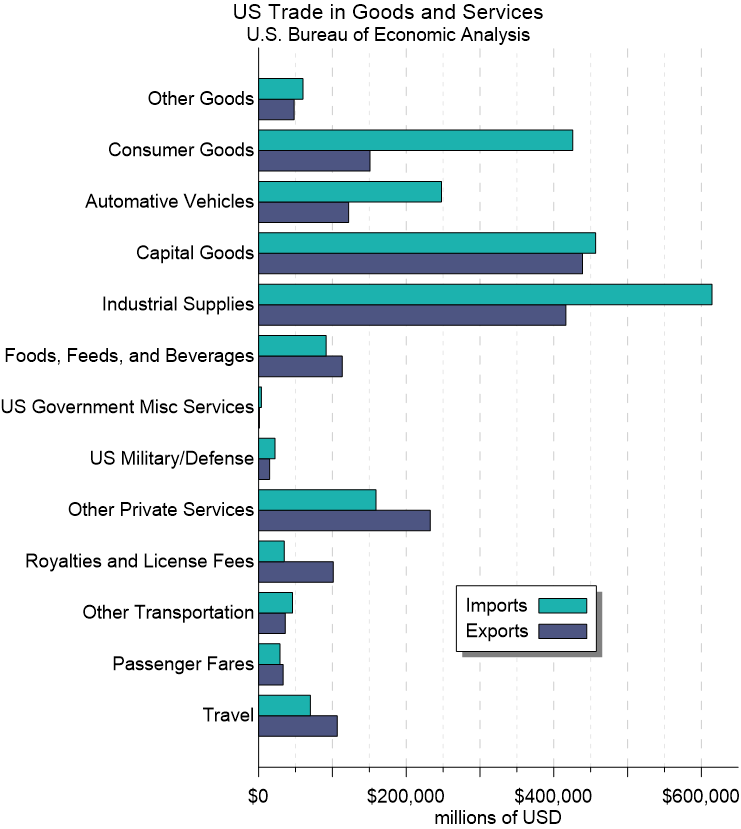
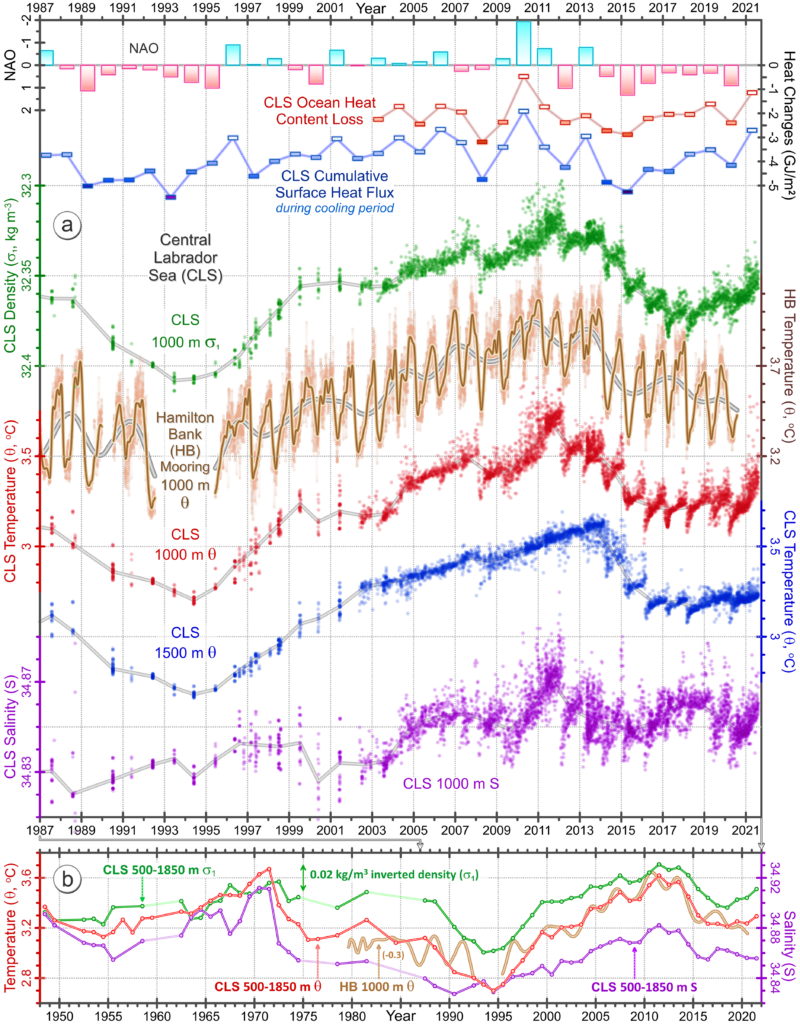
Con Grapher si può scegliere tra 80 formati di grafici diversi: linear o logarithmic line, scatter, bar charts, histograms e 2D o 3D, ecc. Tra i grafici disponibili troviamo grafici specialistici inclusi ternary, box-whisker, bubble plots, pie charts e hi-low-close plots.
I grafici possono essere personalizzati a proprio piacimento aggiungendo legende, analisi delle curve, testi e oggetti disegnati.
Adalta è Rivenditore Ufficiale e Importatore Diretto per l’Italia di Golden Grapher. Richiesta quotazione…
Manutenzione
A cosa serve Grapher?
Grapher helps engineers and scientists interpret and communicate complex datasets with unparalleled accuracy and elegance.
Visualize the Future: Today’s Data, Tomorrow’s Solution
You’re pressed for time with demanding clients, budget pressures, and an ever growing to-do list. You’re also passionate about your work and finding effective solutions to real world problems. Your challenge is communicating these solutions to a broad range of audiences while accurately reflecting the depth of your expertise.
Whether you’re generating plots for an industry presentation, updating quarterly reports for a client’s decommission project, or analyzing the environmental impact over time, Grapher not only conveys complex information clearly, it helps you do it with unparalleled accuracy and elegance.
No Compromising
Your visuals should reflect the depth of your expertise and height of your standards, every time.
Limited only by your imagination, Grapher offers an extensive set of plot types and analysis tools, as well as a robust arsenal of customization options, ensuring your work stands out in any presentation and is worthy of your signature.
Plethora of Plots
Create stunning and informative 2D and 3D plots. Choose from 80+ different plot types including all standard plots and extensive specialty plots like Piper, Durov, stiff, polar, and function.
Complete Compatibility
Seamlessly visualize and analyze data from multiple sources. Import file formats like ACCDB, DBF, and XLSX, and export to popular formats like PDF, TIF, and PNG.
Reveal Insights
Make informed decisions by discovering trends and opportunities hiding in data. Apply custom or pre-defined fit curves, error bars, or compute statistics on the raw data for a thorough understanding.
Unlimited Customizations
If you can imagine it, you can create it. Add title blocks, legends, multiple axes, and plot magnifiers. Customize axis scales, combine multiple graphs, and define custom line styles, colors and fills.
Work Smart, Not Hard
Automate tedious workflows, maximize your impact.
Data visualization often involves tedious processes that can bog down even the most seasoned professionals. Grapher empowers you with cutting-edge tools that streamline the painstaking aspects of data visualization, allowing you to focus on more complex, creative, and impactful endeavors.
Streamlined Workflows
Transform raw data into compelling visuals with just a few clicks. Effortlessly navigate Grapher’s user interface, generate templates for repeated use, and customize the user interface or default settings for maximum efficiency.
Automation
Eliminate human error and time consuming clicks. Use the built-in script recorder or write your own scripts to automate repetitive tasks, freeing up valuable time to focus on more impactful endeavors.
Graph Wizard
Ensure adherence to best practices at every stage of the plot creation process with the Graph Wizard. Providing a guiding hand to both novice and users alike, the wizard guarantees the final plot is both accurate and elegant.
Get Inspired
Determine the most appropriate plot type for your data or explore new ways to represent data with the graph gallery. This visual catalog shows all plot types that are possible with Grapher.
Facilitate Understanding Across Audiences
Grapher facilitates ‘Aha!’ moments for technical and non-technical audiences alike.
Introduce fresh perspectives and foster collaboration by sharing your work with colleagues, stakeholders, and others in your industry. When exporting to high quality formats like PDF or TIFF, your plots are ready for publication. Share your work online by exporting to PNG or SVG formats, or insert directly into Microsoft Word or PowerPoint with a simple copy and paste.
Cosa c’è di nuovo in Grapher 26.x?
L’ultima versione di Grapher presenta numerose novità!
Le principali sono elencate di seguito.
A more complete list of the new features can be found here:
Comments in documents
Leave yourself or your colleagues comments directly in the project to help you remember where you left off, take note of particular elements, or communicate updates. The comments stay saved with your document and don’t impact any exporting or printing outputs. They are easy to turn on and off as you need them with a click of a button.
Templates (new style)
Get started and finished in seconds – load a locally installed template, or open one from the Golden Gallery and instantly populate your data into a polished, presentation-ready layout. You can find these templates from the Welcome screen or from Grapher’s Home tab.
The Template Gallery offers many different kinds of graphs at your fingertips. Here you can search, browse categories by type, or simply scroll through to see the options.
Visiting the Golden Gallery, you’ll find an even greater multitude of templates available that are ever growing and expanded use cases: https://gallery.goldensoftware.com/
Each template comes with a full description of what it is, why to use it, which industries it’s common in, and how the data layout should look. No more headaches trying to figure out what you need to visualize your data in graphs like these, just plug and play!
Once you have your template open in Grapher, a special view opens giving you options to populate it with your own data and adjust any other settings.
You can also create templates from your existing projects to streamline inserting new data or train new team members to duplicate the same results. This can be a big help when revisiting projects from the past that you need to use again and may have forgotten about how to set them up. Save them to your own custom template to easily access and reuse directly from the program:
Automate loading multiple files for templates
Now it’s possible to automate loading a template and all its required data files in a single step.
Sub Main
    Dim Grapher As Object
    Set Grapher = CreateObject("Grapher.Application")
    Grapher.Visible = True

    ' Set up worksheet files to use for the template in the same order as specified (if you don't know, open the template in the UI and check the Populate Template dialog')
    ' Can also do the same for grid files
    Dim wksFiles(1) As String
    wksFiles(0) = Grapher.Path + "\Samples\3D Bar Chart.dat"
    wksFiles(1) = Grapher.Path + "\Samples\3D Bubble Plot.dat"

    ' Open the template and load it with all required worksheets
    Set template = Grapher.Documents.Open("c:\users\me\desktop\example_template_using_two_wks_files.grt")
    template.PopulateTemplate(wksFiles, "")
End Sub
Further streamline your workflow by running a script to automatically load all data into your existing template and output a complete project in a single click.
Improvements
New script: Change font for all objects
Run this script to easily change all the font and/or size used throughout the document at once. This makes a tedious task quick and easy and let’s you easily apply uniformity to your display.
New script: Create color scale for class legend
Run this script to create a color scale for any class type plot (Class Scatter, Ternary, Polar, etc.) to view a color scale for the legend instead of discrete values.
Intuitive group controls
Organizing projects just got a whole lot easier with grouping functionality that isn’t limited by other actions. There are clear indicators when you’re working with objects in a group and you can delete, add, or modify anything you need in a group without having to toggle a special tool mode.
Pan while moving labels
No interruption to your customizations while you need to adjust your labels. Get in close and pan around while you move labels on plots, axes, or titles.
Tools for drillhole data visualization
Grapher could always create important assets to help visualize aspects of your drillhole data, but now we have some tools that help streamline those customizations for you.
Check out these essential templates for depth logs, tadpole plots, and lithology logs:
Check out Creating Borehole & Cross-Section Logs also for a script to create well construction logs such as the following:
Requisiti di sistema di Grapher
I requisiti di sistema di Grapher sono elencati di seguito.
- Windows 10, 11 or higher
- 64-bit operating system support
- 1024 x 768 or higher monitor resolution with minimum 16-bit color depth
- At least 500 MB free hard disk space
- At least 512 MB RAM