Esplorate le profondità dei vostri dati.
Surfer è il software leader per la mappatura, la modellazione e l’analisi dati.
Permette di convertire i dati nei seguenti tipi di mappe: contour, 3D wireframe, vector, image, shaded relief, post, base.
La mappa può essere scelta tra quelle in archivio o creata miscelando gli elementi di diverse mappe; può essere poi personalizzata in tutti i suoi elementi al fine di arrivare al risultato desiderato.
Con Surfer la produzione di mappe di qualità è non è mai stata cosi veloce e semplice.
Adalta è Rivenditore Ufficiale e Importatore Diretto per l’Italia di Golden Surfer. Richiesta quotazione…
Manutenzione
A cosa serve Surfer?
Surfer helps engineers and scientists interpret complex geospatial datasets and transform them into insightful and understandable publication-ready models
Communicate with Confidence
You’re pressed for time with demanding clients, budget pressures, and an ever growing to-do list.
You’re also passionate about leveraging your expertise to find effective solutions to real world problems. Your challenge is communicating these solutions to both technical and non-technical people.
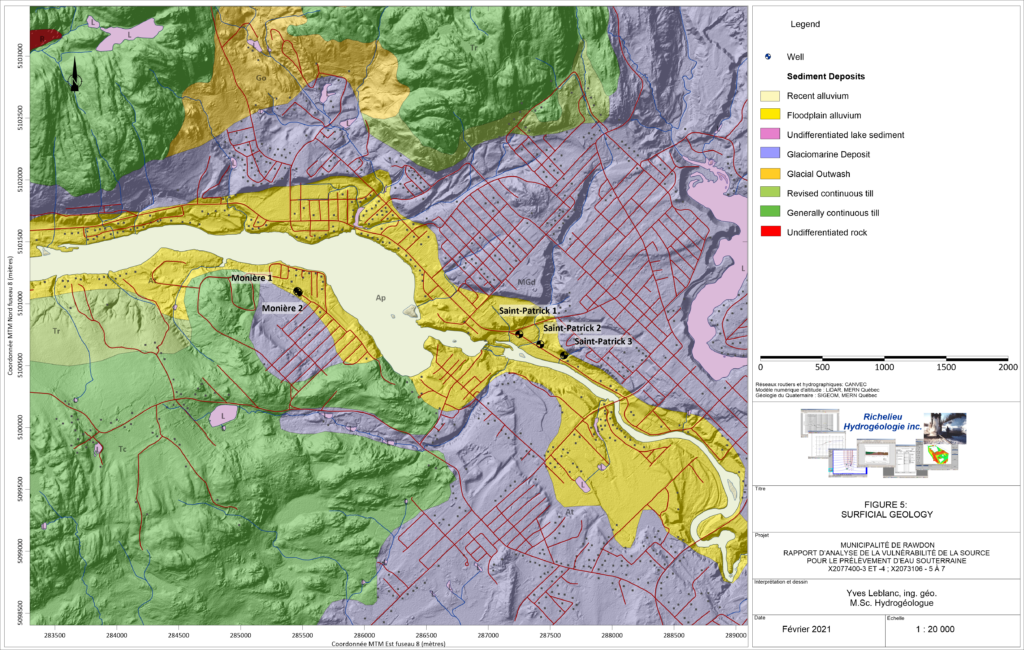
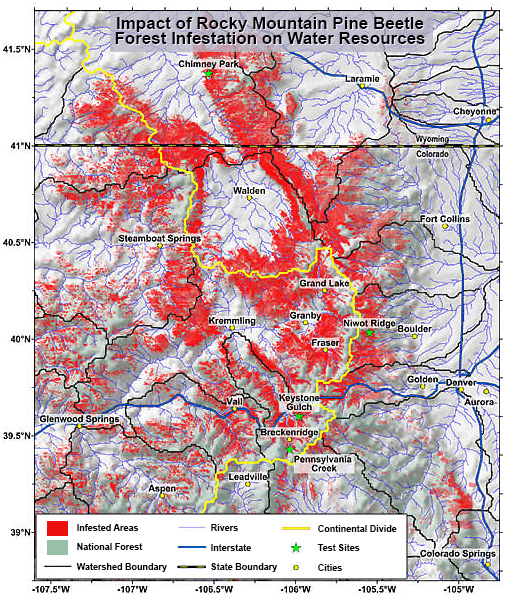
Whether you’re developing models for groundwater contamination, mineralization concentration, site suitability, potentiometric surfaces, or terrain analysis, Surfer helps you better understand the full extent of the site and communicate your findings to a broad range of audiences.
Effortlessly Manage Data to Save Time
How many times have you heard, “Yes, I have all the digital data for the site!” only to receive hundreds of unreferenced files?
You have the daunting task of transforming this information into something understandable from which to pull actionable insights.
Surfer offers a variety of tools to streamline the challenging data assembly process.
Complete Compatibility
Import and export numerous file formats like SHP, DXF, PDF, LAS/LAZ, and XLSX, georeference images, and effortlessly manage unreferenced data and data in different and multiple coordinate systems.
Robust Interpolation
Transform regularly or irregularly spaced XYZ or XYZC data onto a grid or raster with 12 different interpolation methods including Kriging, Inverse Distance to a Power, and Triangulation with Linear Interpolation.
Full Control
Each interpolation method provides complete control over all gridding parameters, including options to incorporate anisotropy, faults, breaklines, and variogram models.
New Insights
Incorporate old data into your model with Surfer’s georeferencing and digitizing tools and the option to generate grid or raster files directly from contour maps.
Enhanced Visuals
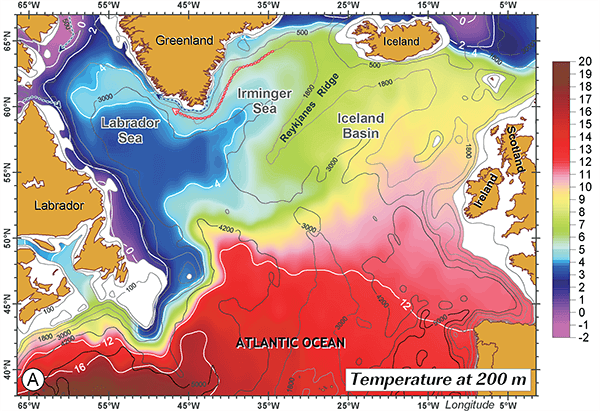
Visualize grids using 10 different map types such as contours or surfaces, and combine the data with other layers like aerial photographs, spot locations, drillhole data and LiDAR point clouds.
True 3D
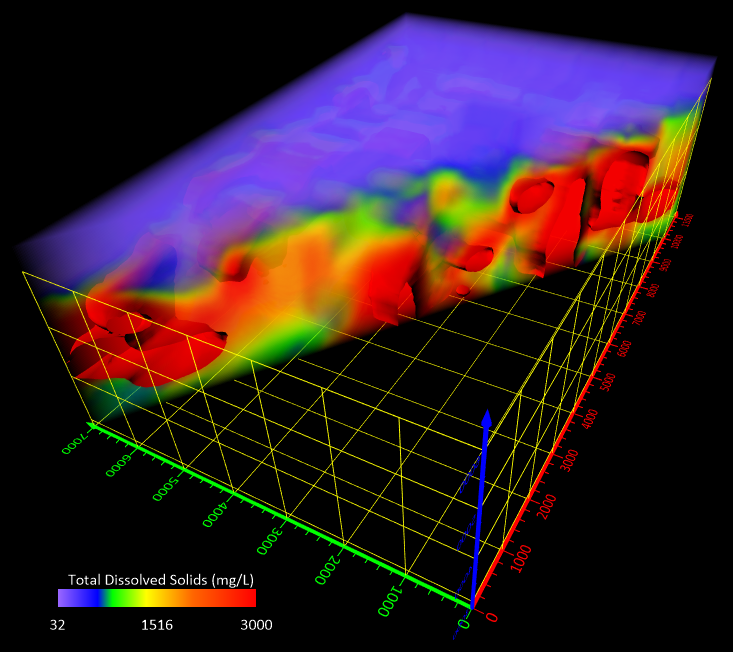
Level up your model with true 3D interpolation. Add point locations, surfaces, drillhole paths and data, and 3D XYZC grids as rendered volumes or isosurfaces in true 3D space.
Develop Eye-Opening Insights
Stakeholders rely on you to provide insights that save time, money, and headache.
Surfer empowers you with a robust set of analysis features.
Ensure Accuracy
Adjust interpolation and gridding parameters to ensure accuracy and increase confidence in the interpolated dataset. Include variogram models, define faults and breaklines, or generate grid statistics to identify trends or anomalies.
Reveal Insights
Apply mathematical operations on grid files, also known as matrix math. Generate isopach or isocore maps, calculate contamination volumes, identify anomalies, model groundwater flow and solute transports, or calculate slope, aspect, or curvature.
Eliminate Uncertainty
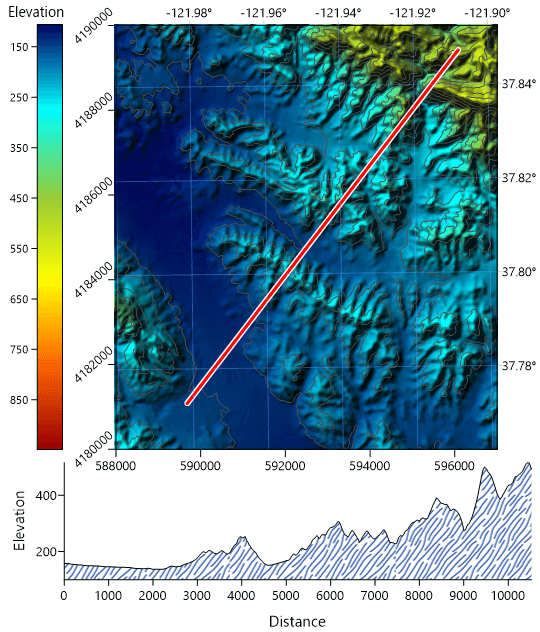
Bring subsurface characteristics to light with cross sections or profile maps or explore the data from every angle in Surfer’s 3D view as you fly between drillhole paths and inspect all aspects of isosurfaces and volumes.
Facilitate Understanding Across Audiences
There’s nothing better than seeing your work transform into something real and tangible. Surfer facilitates “AHA!” moments for technical and non-technical audiences alike.
You have full control of the final display. Practically every aspect of your Surfer model is customizable.
Enhance Maps & Models
Add title blocks, company logos, legends, scale bars, cross sections, magnifiers, or multiple axes. Add context with imagery that’s imported or downloaded from online servers directly within Surfer.
Share Your Work
Copy and paste directly into PowerPoint or Word, export all of some map layers to DXF for AutoCAD, provide the field crew with a KMZ file to view the model in Google Earth, or export to PDF, 3D PDF, or TIF for your final report.
Bridge the Gap
Help investors fully conceptualize the extent of the project by walking them through the site in 3D all from the comfort of the boardroom. Highlight areas of interest, pinpoint the source of contamination, and clarify the full extent of the remediation efforts.
Cosa c’è di nuovo in Surfer 31?
L’ultima versione di Surfer presenta numerose novità!
Le principali sono elencate di seguito.
A more complete list of the new features can be found here:
Top Features in Surfer’s Latest Release
3D Drillhole Visualization
We’ve made the visualization in the 3D view more robust and user friendly than ever before, to save you time and headaches.
Create Contact Surfaces from 3D Drillhole Data
Connect lithologies or horizons between drillholes to help build a more complete model of the subsurface! In the previous release, you could create, edit, and save contact points from drillhole data. Now, you can take it a step further: automatically generate contact surfaces from those same points—with just a simple checkbox.
Define the surface type as either depositional or erosional (to help constrain the surface interactions), and check the box to create the surface. That’s it! All gridding parameters are fully configurable in the Properties window, allowing you to instantly adjust settings and visualize the impact on the surface in real time.
It’s fast, intuitive, and designed to streamline your modeling workflow.
Check a box to create surfaces from points of contact in 3D drillhole data.
Record Video
If a picture is worth a thousand words, what is a video worth? 3D visualization is one of the most effective ways to explore data, reveal patterns, and detect anomalies in spatial context. But when it comes to sharing that insight with others, static images—or even interactive 3D PDFs—can fall short.
To address this, you can now record the 3D View window and export it as an MP4 video. Rotate the scene, toggle layers, zoom, or walk on the surface—all while capturing your on-screen actions. This allows you to communicate complex results clearly and efficiently to clients, colleagues, and stakeholders.
Press Start Record and record the 3D View window! Turn layers on or off, change colors, rotate the model – it’s all recorded for you to save in a compact MP4 file for you to share with clients and stakeholders.
Add Point Labels to Vector Data
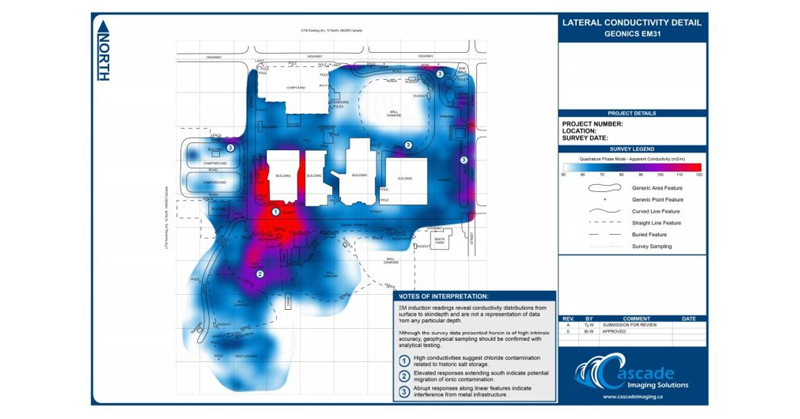
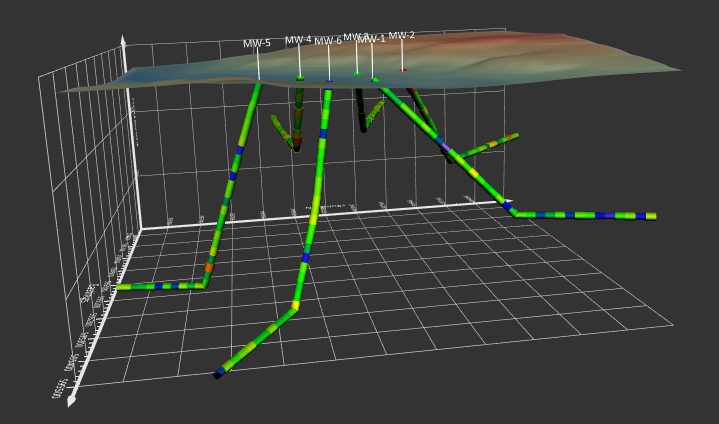
Point labeling is now supported in the 3D View for both base and post layers, enabling the visualization of key data attributes such as concentration values, sample and spot locations, resistivity profiles at depth, and other geospatial parameters.
Label point symbols in the 3D View.
Orient Imported Images using Polylines and Polygons
We get it – locating images imported into the 3D view can be time consuming, especially when you have 5+ images to manually place in the model or when the path of the image is not a straight line. Now you can import an image into the 3D view, and use any existing polyline or polygon in the map as the path for the image. Have 10 profiles you want to locate? Not a problem. Draw the 10 polylines on the map, then import the images and set each image to follow one of the polylines. They can be curvy or straight. The image is warped to the path of the polyline/polygon. You also have complete control over the Z placement, to move the image up or down in the model.
Choose to orient imported images along existing polyline or polygon paths.
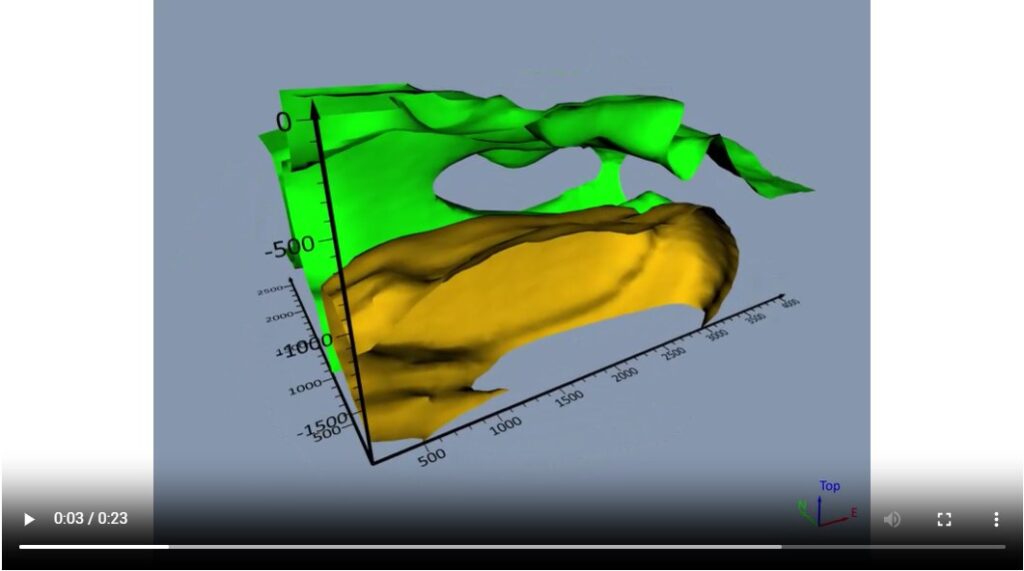
Isosurfaces can Ignore NoData values
Isosurfaces can now ignore NoData values in the 3D grid file. Previously the NoData nodes needed to be treated as some specified data value (the data minimum, the data maximum or a custom value), which could cause undesired surface geometry or volume calculations. Now just simply ignore any NoData values and see your isosurface as it truly is!
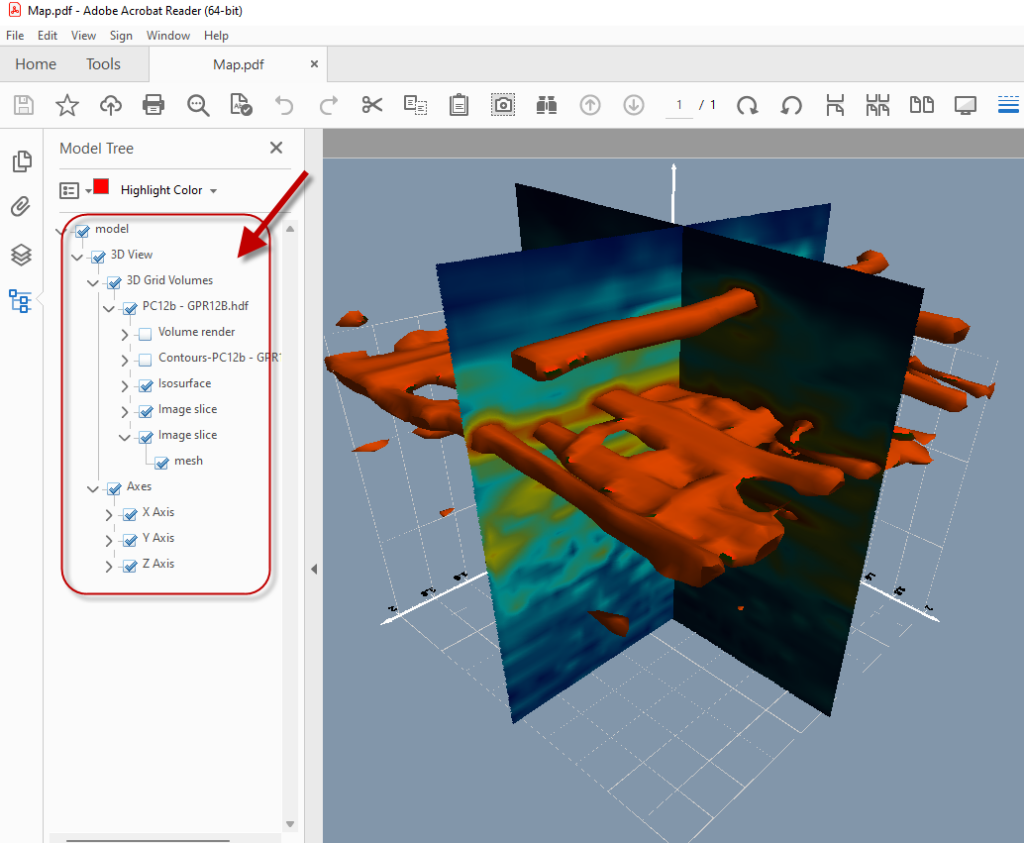
Choose the Interpolation type for Image Slices
Image slices are a powerful way to emphasize or display the contents of a 3D grid along a specific cutting plane. They can show colorful detailed images through your data. You have the option now to select the interpolation method for the images. You can select Tri-linear interpolation, which creates a very nice image with smooth gradations between the colors; or, if you want more precise coloring, you can now select Nearest Neighbor interpolation. Choose nearest neighbor interpolation for your image slices, and have distinct colors next to each other without interpolation and gradation in between.
In this example, the image slice in the background uses Nearest Neighbor interpolation and matches the drillhole data exactly (accounting for angle of view)
Save Fly-Through Videos as MP4
Fly-throughs are a fun way to share your model with others. Fly through your model along a specified polyline or polygon path and record the fly-through to a file. Now you can save your fly-through as an MP4 file, delivering higher quality with lower file sizes than the previous AVI file format.
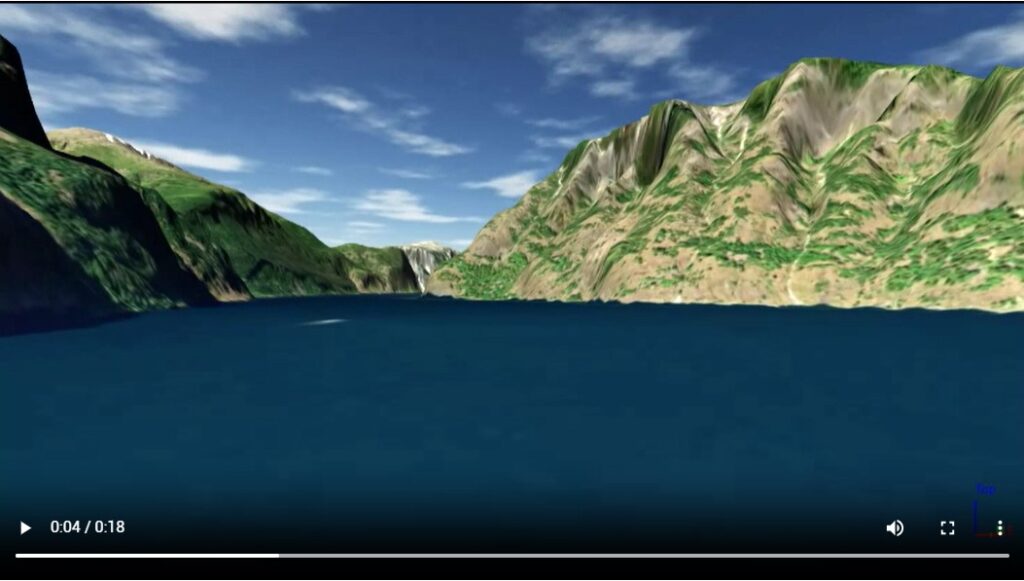
Save a Fly-Through to an MP4 file! This is a flight through the Aurlandsfjord and Nærøyfjord from Flåm to Gudvangen in Norway.
Import and Export AutoCAD Drawing (DWG) Files
No more converting DWG to DXF—Surfer now supports direct DWG import. You can now import AutoCAD *.DWG files directly into Surfer as base layers, with full control over which drawing layers to include. Maintain the original layer structure and optionally import each DWG layer into separate base layers for easier editing and organization.
Once imported, create your maps, make any necessary modifications, and export the results back to a DWG file—ready to share with your drafting team or collaborators. It’s a seamless workflow from CAD to Surfer and back again.
Import an AutoCAD Drawing (*.DWG) file, select which layers to import, and chose to import them into separate base layers! It’s easy to keep your data organized.
Import DXF Layers into Separate Base Layers
Import your AutoCAD Drawing Interchange (DXF) file and easily view and select which layers to import. In addition, choose to import each DXF layer into separate base layers for easier editing and organization.
Easily select which layers from your DXF file to import and choose to import them into separate base layers in your map!
Legend Improvements
Legends now include more options and more layers to help you explain your map in the most meaningful way!
Add Contour Layers
Enhance your legend with contour lines and labels! In addition to a color scale bar, you can now include contour lines directly in your map legend. Display major or minor contours—or specify exact levels—to clearly communicate key information, whether it’s elevation, depth, concentration, etc.
For example, you might show a blue line labeled “2 ft saturated alluvium contours,” or indicate that light blue lines represent groundwater level contours (mAHD). Including contour details in your legend ensures that your audience has all the context they need to accurately interpret your map.
Add Drillhole Layers without Symbology
Include drillhole symbols in your legend—even without symbology. Users can now display drillhole symbols in the legend, even when symbology is not applied. This makes the map easier to interpret by clearly identifying drillholes for the viewer. There’s no need to manually add symbols and text objects—simply include them directly in the legend. This feature enhances the usefulness of your legend by providing more complete information about the map’s content.
Add contours and drillholes without symbology to your legend.
Additional Legend Improvements
Map legends now provide additional information to help explain the components of a map. By default, the legend automatically generates descriptive labels for individual samples using the layer name, so users don’t need to manually adjust the templates. Additionally, the legend for pie slices display the line around the fill, making it easier to identify each section. The result is a cleaner, more intuitive legend that is easier for clients and stakeholders to understand.
Use the layer name as the legend label and show the line properties around the fill sample for pie charts.
Working with Coordinate Systems is Easier than Ever
Ever wonder if you selected the correct coordinate system? Do you know the EPSG code, but not sure if the one you selected in Surfer matches? Surfer eliminates this potential confusion by displaying the EPSG code for the selected coordinate system! No more guesswork.
In addition, we’ve made improvements across the board to make sure you don’t run into issues assigning or changing coordinate systems for your maps and layers. More informative warnings, streamlined workflows, and improved searching capabilities!
The EPSG codes for most coordinate systems and datums are displayed in Properties and in the Assign Coordinate System dialog, helping you make the correct choice!
XYZC Gridding supports Nearest Neighbor!
Do you create a spreadsheet of XYZC data or get 3D data from your equipment that is already regularly spaced? No interpolation needed! You can use the new Nearest Neighbor gridding method to transform that regularly spaced data into a 3D grid, ready for visualization in the 3D view! Just be sure to set the grid spacing in the X, Y and Z directions to match the data point spacing, and it’s as easy as can be.
Grid your XYZC data using the Nearest Neighbor gridding method.
Help is at Your Fingertips
Get the Help you need faster and easier with the new Help ribbon page! Check for updates, contact technical support, or access our comprehensive Help system – no more wasting time looking for how to get help when you need it.
The Help commands are easily accessible on the new Help ribbon page.
Requisiti di sistema di Surfer
Surfer is a Windows based, desktop software.
For Mac, Linux, or Unix users, Surfer can be run using your preferred Windows emulator. We recommend testing the functionality with our trial version before purchasing.
Minimum requirements
- Windows 10, 11, or higher
- 64-bit operation system
- 1024×768 or higher monitor resolution with minimum 16-bit color depth
- 500 MB free hard disk space
- 512 MB RAM
- 3D View: Graphics supporting OpenGL v3.2 or later
System recommendations for best performance
- Windows 10, 11, or higher
- 64-bit operating system
- 500 GB or larger hard-drive with at least 25% disk space available, or higher
- 16 GB RAM, or higher
- 3D View: Graphics card (e.g. NVIDIA, AMD, etc)
Optional settings
- Gridding, contouring, and color relief operations, all of which are heavily computational, are processor reliant and are multi-threaded. In Surfer, you will find a setting at File | Options | General | Max number of processors to use. It should be set to use all cores.
- For gridding and contouring operations, CPU performance is important. The more cores the better.
- When working consistently with very large data files, more RAM is important.
- Turning off auto recovery can help performance in some cases. It is OFF by default, but it can be enabled at File | Options | General | Save auto recovery information.