Analizzare e presentare graficamente il proprio lavoro scientifico.
Prism è un ottimo software per la biostatistica di base e la grafica scientifica.
Grazie alla semplicità di approccio, alla potenza di analisi e di grafica negli esperimenti ripetitivi, all’applicazione del test statistico più appropriato, alla capacità di interpretazione dei risultati, Prism è il software ideale per l’applicazione nelle scienze della vita.
Creato per i ricercatori di laboratorio e ricercatori clinici, Prism guida l’utilizzatore, anche privo di conoscenze statistiche, attraverso il processo di analisi supportandolo con tutto l’aiuto che necessita; è possibile così concentrarsi sui dati e non sul funzionamento del software.
Tra le aree di ricerca in cui è utilizzato, è particolarmente apprezzato nell’industria farmaceutica, in ambito di ricerca nelle biotecnologie e per la statistica medica.
Adalta è Rivenditore Ufficiale e Importatore Diretto per l’Italia di GraphPad Prism software. Richiesta quotazione…
Link utili
Caratteristiche di Prism
Comprehensive Analysis e Statistiche potenti, semplificate
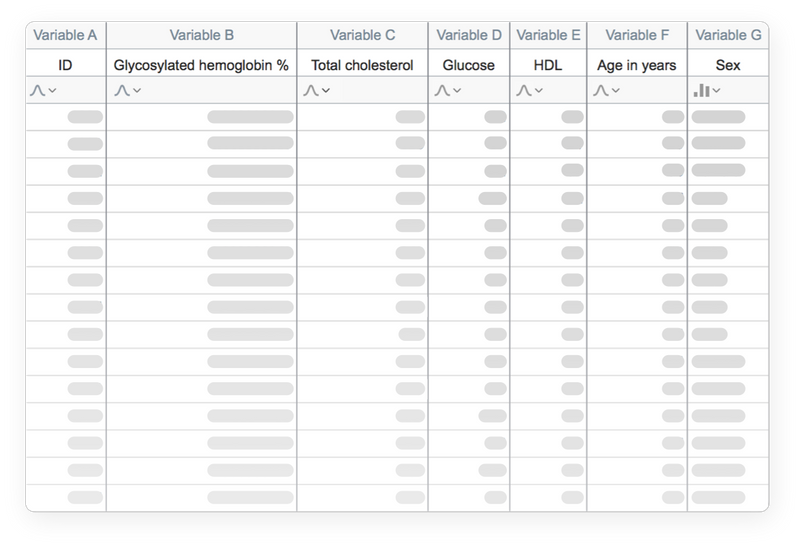
Organizza i dati in modo efficace
Prism è formattato specificamente per le analisi che si desidera eseguire, compresa l’analisi di dati quantitativi e categorici. In questo modo è più facile inserire correttamente i dati, scegliere le analisi adatte e creare grafici straordinari.
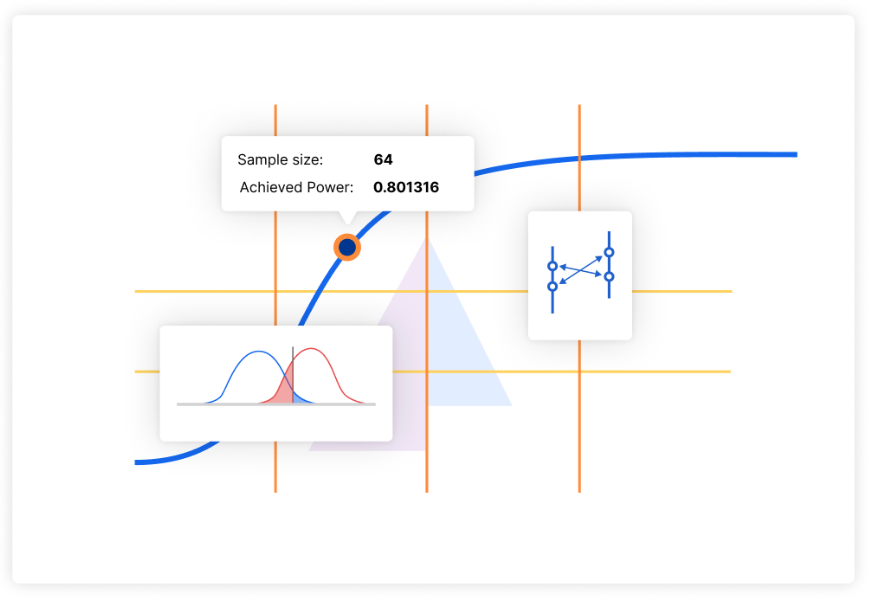
Analisi della dimensione del campione e della potenza
Ottimizza i tuoi esperimenti fin dall’inizio determinando con precisione la dimensione del campione necessaria per l’effetto previsto, oppure studia l’effetto più piccolo che riesci a rilevare con una dimensione del campione limitata.
Snellisci il tuo processo di ricerca, risparmia risorse preziose e aumenta l’affidabilità dei tuoi risultati.
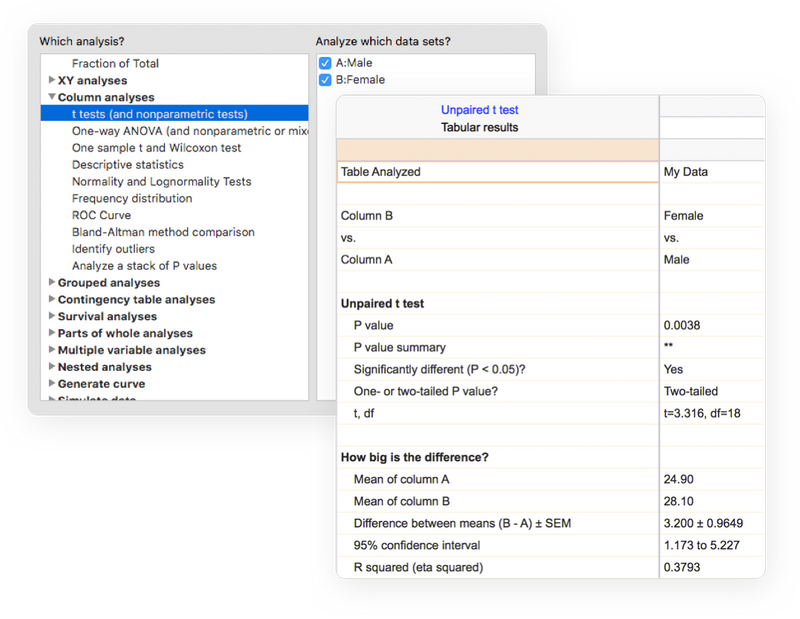
Esegui la giusta analisi
Evita il gergo statistico. Prism presenta con un linguaggio chiaro un’ampia libreria di analisi, da quelle più comuni a quelle più specifiche: T-Test, ANOVA a una, due e tre vie, regressione lineare e regressione non lineare, dose-response curves, binary logistic regression, analisi di sopravvivenza, principal component analysis e molto altro ancora.
Ogni analisi è accompagnata da una checklist che aiuta a comprendere i presupposti statistici richiesti e a confermare la scelta del test appropriato.
Ottieni un aiuto concreto mentre si va avanti
Riduci la complessità delle statistiche. La guida online di Prism supera le tue aspettative. A quasi ogni passaggio, accedi a migliaia di pagine delle Guide Utente di Prism. Impara da lezioni video, guide e materiali didattici tramite il Centro Risorse. Esplora il Portfolio Grafici e impara a creare un’ampia gamma di tipi di grafici.
I set di dati dei tutorial ti aiutano anche a capire perché dovresti eseguire determinate analisi e come interpretare i risultati.
Work Smarter, Not Harder
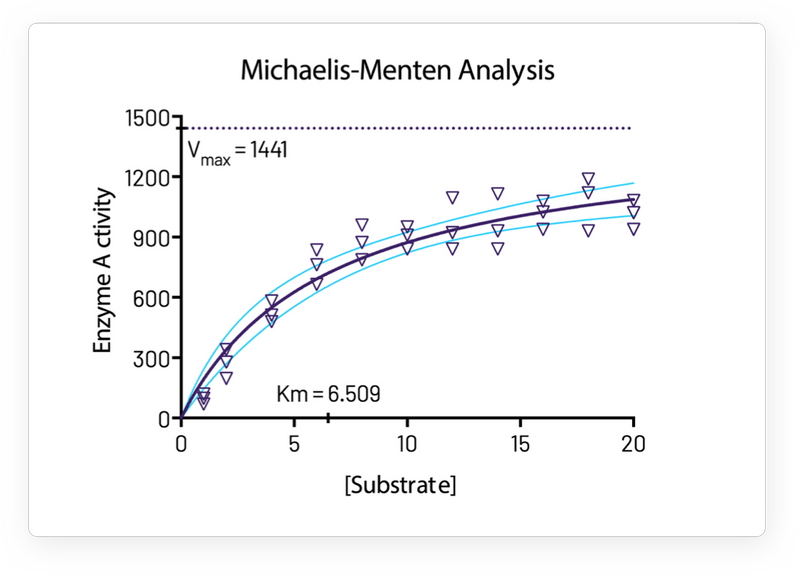
One-Click Regression Analysis
Nessun altro programma semplifica il curve fitting come Prism. Seleziona un’equazione e Prism fa il resto: adatta la curva, visualizza una tabella dei risultati e dei parametri della funzione, disegna la curva sul grafico e interpola i valori sconosciuti.
Concentrati sulla ricerca, non sul software
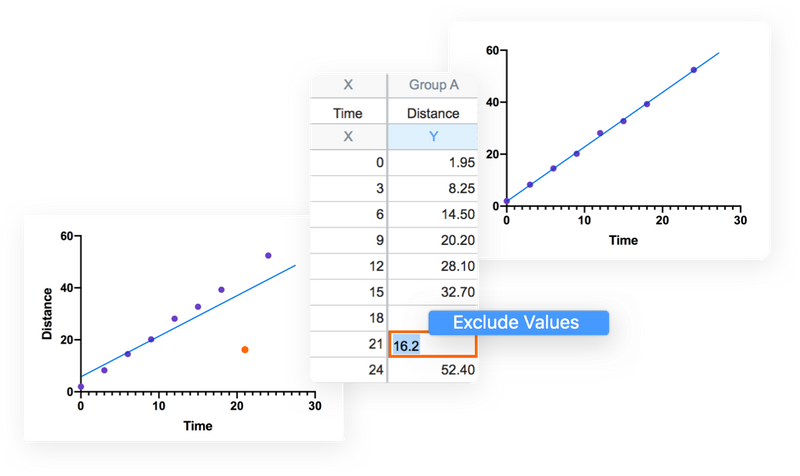
Prism gestisce la codifica per te. Grafici e risultati vengono aggiornati automaticamente in tempo reale. Qualsiasi modifica ai dati e alle analisi – inserimento diretto di dati, eliminazione di dati errati, correzione di errori di battitura o modifica delle scelte di analisi – si riflette istantaneamente su risultati, grafici e layout.
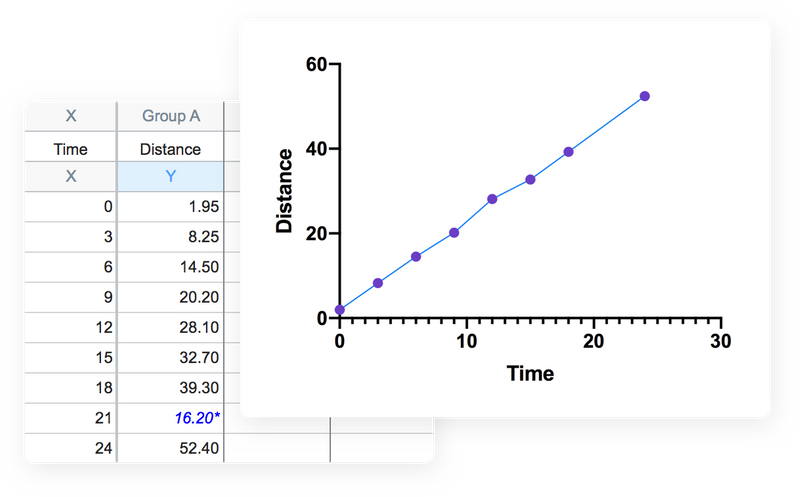
Concentrati sulla tua ricerca, non sul tuo software
Prism gestisce la codifica per te. Grafici e risultati vengono aggiornati automaticamente in tempo reale. Qualsiasi modifica ai dati e alle analisi (inserimento diretto di dati, omissione di dati errati, correzione di errori di battitura o modifica delle scelte di analisi) si riflette istantaneamente nei risultati, nei grafici e nei layout.
Automatizza il lavoro senza programmare
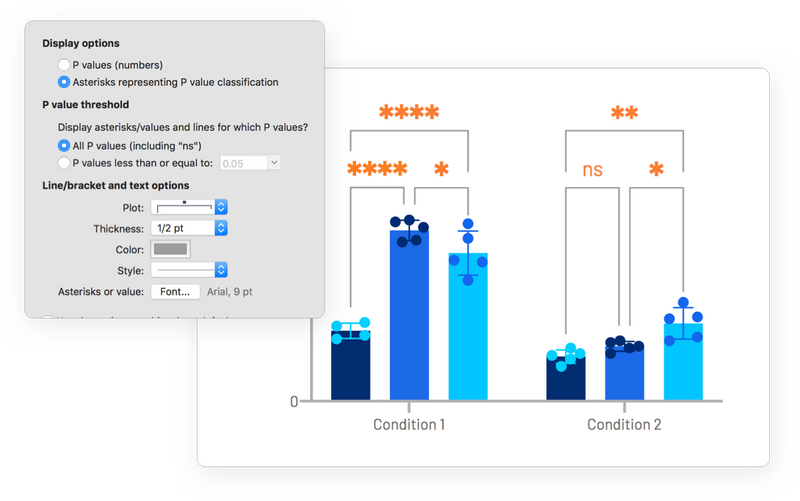
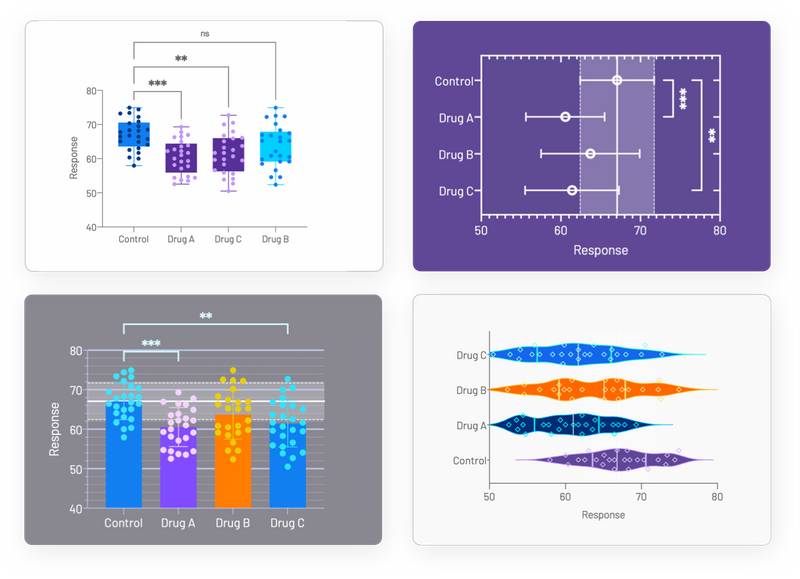
Aggiungere automaticamente multiple pairwise comparisons all’analisi con un solo clic. Per le opzioni di personalizzazione di queste linee e asterischi, è sufficiente fare nuovamente clic sul pulsante della barra degli strumenti. Se si apportano modifiche ai dati o all’analisi, i risultati visualizzati sul grafico si aggiornano automaticamente.
Il modo più veloce per graficare e condividere con eleganza il tuo lavoro
Innumerevoli modi per personalizzare i grafici
Concentrati sulla storia dei tuoi dati, non sulla manipolazione del software. Prism semplifica la creazione dei grafici che desiderate. Scegli il tipo di grafico e personalizzane ogni parte: la disposizione dei dati, lo stile dei punti di dati, le etichette, i caratteri, i colori e molto altro ancora. Le opzioni di personalizzazione sono infinite.
Esplora i tuoi dati
Risparmia tempo e semplifica il flusso di lavoro trasformando i dati sul posto, senza bisogno di fogli di analisi aggiuntivi. Per i dati a variabili multiple, crea nuove variabili calcolate con formule in stile foglio di calcolo. Calcola rapporti, applica logaritmi o normalizza i valori senza uscire dalla tabella dati. I risultati vengono visualizzati come nuove variabili, mantenendo intatti i dati originali e mantenendo connessioni in tempo reale con le variabili sorgente.
Hai notato qualcosa di interessante? Evidenzia un singolo punto dati per esplorarne le proprietà corrispondenti. Personalizza il modo in cui presenti le relazioni nei dati per esplorare efficacemente dataset di grandi dimensioni. Grazie alle solide funzionalità di data wrangling di Prism, puoi iterare rapidamente garantendo che l’analisi si basi su dati puliti e ben strutturati.
Esportazione di grafici di qualità editoriale in un clic
Riduci i tempi di pubblicazione. Prism consente di personalizzare le esportazioni (tipo di file, risoluzione, trasparenza, dimensioni, spazio colore RGB/CMYK) per soddisfare i requisiti delle riviste. Salva le tue impostazioni predefinite per risparmiare tempo.
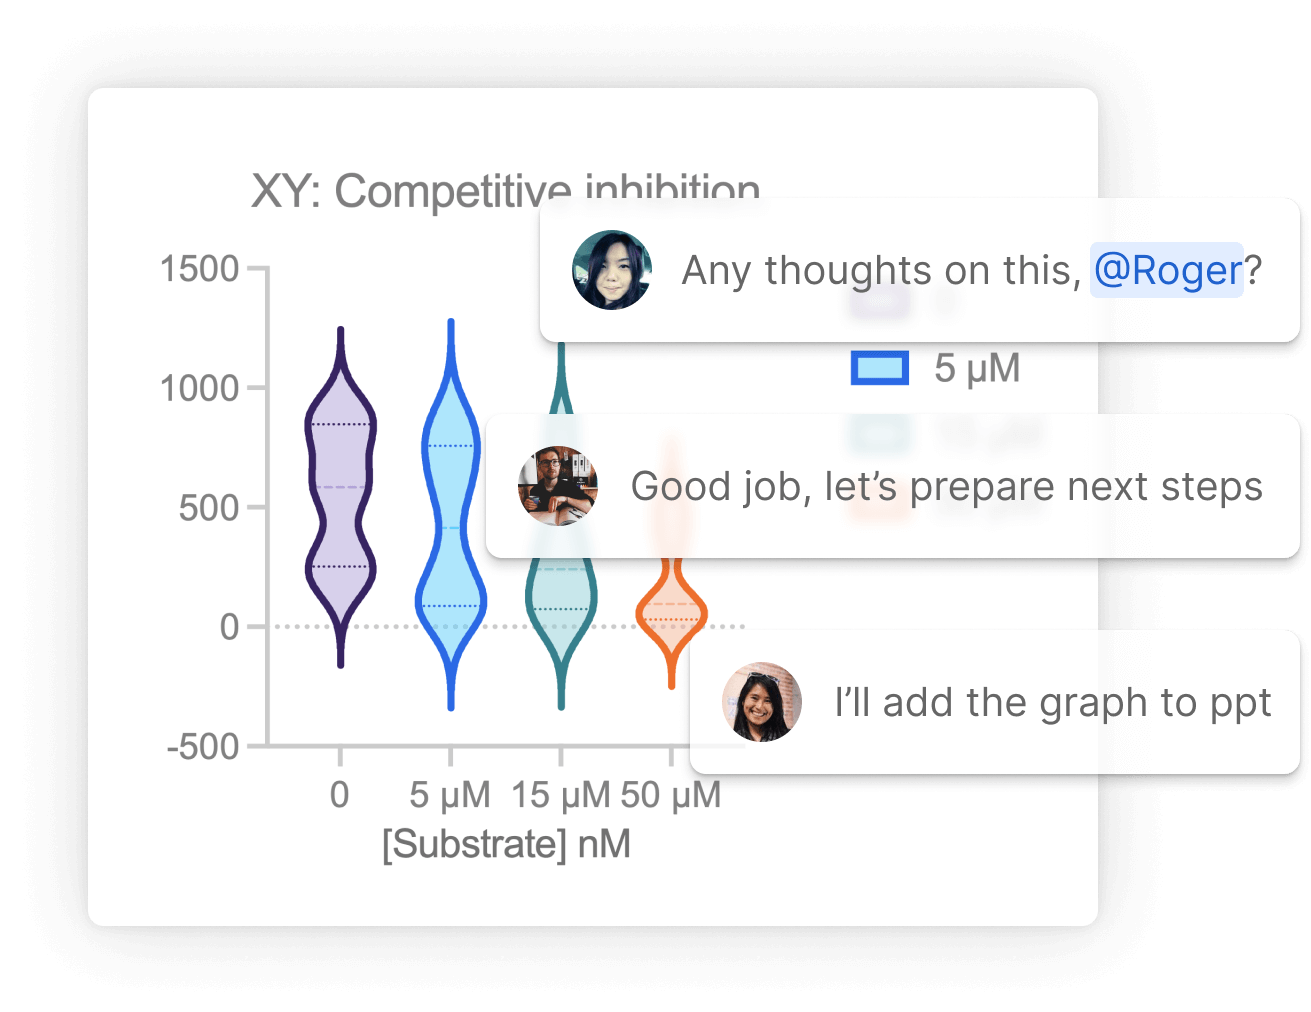
Migliora la collaborazione
Evita le lunghe e caotiche conversazioni via email e usa Prism Cloud per condividere, visualizzare e collaborare ai tuoi progetti Prism, che si trovino dall’altra parte del corridoio o dall’altra parte del mondo. Carica i file direttamente da Prism o dal tuo browser e assegna ruoli flessibili all’area di lavoro, dai visualizzatori ai gestori dei contenuti, per controllare con precisione l’accesso.
Proteggi l’interoperabilità e la riutilizzabilità dei tuoi risultati con il formato file open access di Prism. Utilizzando formati standard di settore (CSV, PNG, JSON, ecc.), puoi garantire che i tuoi progetti possano essere utilizzati al di fuori di Prism, aprendo nuove possibilità per i tuoi flussi di lavoro e le tue integrazioni di dati.
Versioni disponibili per Prism
Prism è disponibili in diverse versioni (Prism Plans):
Standard Plan
Pro Plan
Organization Plan
Enterprise Plan
Ogni versione fornisce diverse funzionalità al software: dall’accesso tramite protocollo SSO, alle statistiche avanzate come K-Means e Hierarchical Clustering, …
Per confrontare tutte le caratteristiche e scegliere la versione più adatta alle proprie necessità è possibile visionare la tabella PRISM Plan Comparison sotto riportata e visionare la lista delle domande più frequenti.
Legacy Plans
No longer available to new customers, you may be on a Legacy plan currently if you have a Serial Number license like a GPS-9872345-LAT1-#####. You can continue to use your Legacy license, but we encourage you to consider upgrading to take advantage of the new capabilities.
New Plans
Our new subscription plans offer options for students, individual researchers and groups, and introduce an Enterprise plan for organizations with more complex needs. The new plans include:
- Named-user licenses with email login for activation – serial numbers no longer needed!
- Up to 2 computers per user – users can now manage activations themselves
- User and device management tools for group administrators
- Streamlined activation with Single Sign On (SSO) and user provisioning (SCIM) for Organization and Enterprise plans
- Collaboration with Prism Cloud – in beta, not available in all regions
- New Power & Sample Size analyses with multiple experimental designs – part of Prism Cloud
- (Pro and Enterprise plans) New Machine Learning techniques
- (Enterprise plan add-on) Dotmatics Luma Integration for unifying data and workflows across applications
- And more – see full comparison below
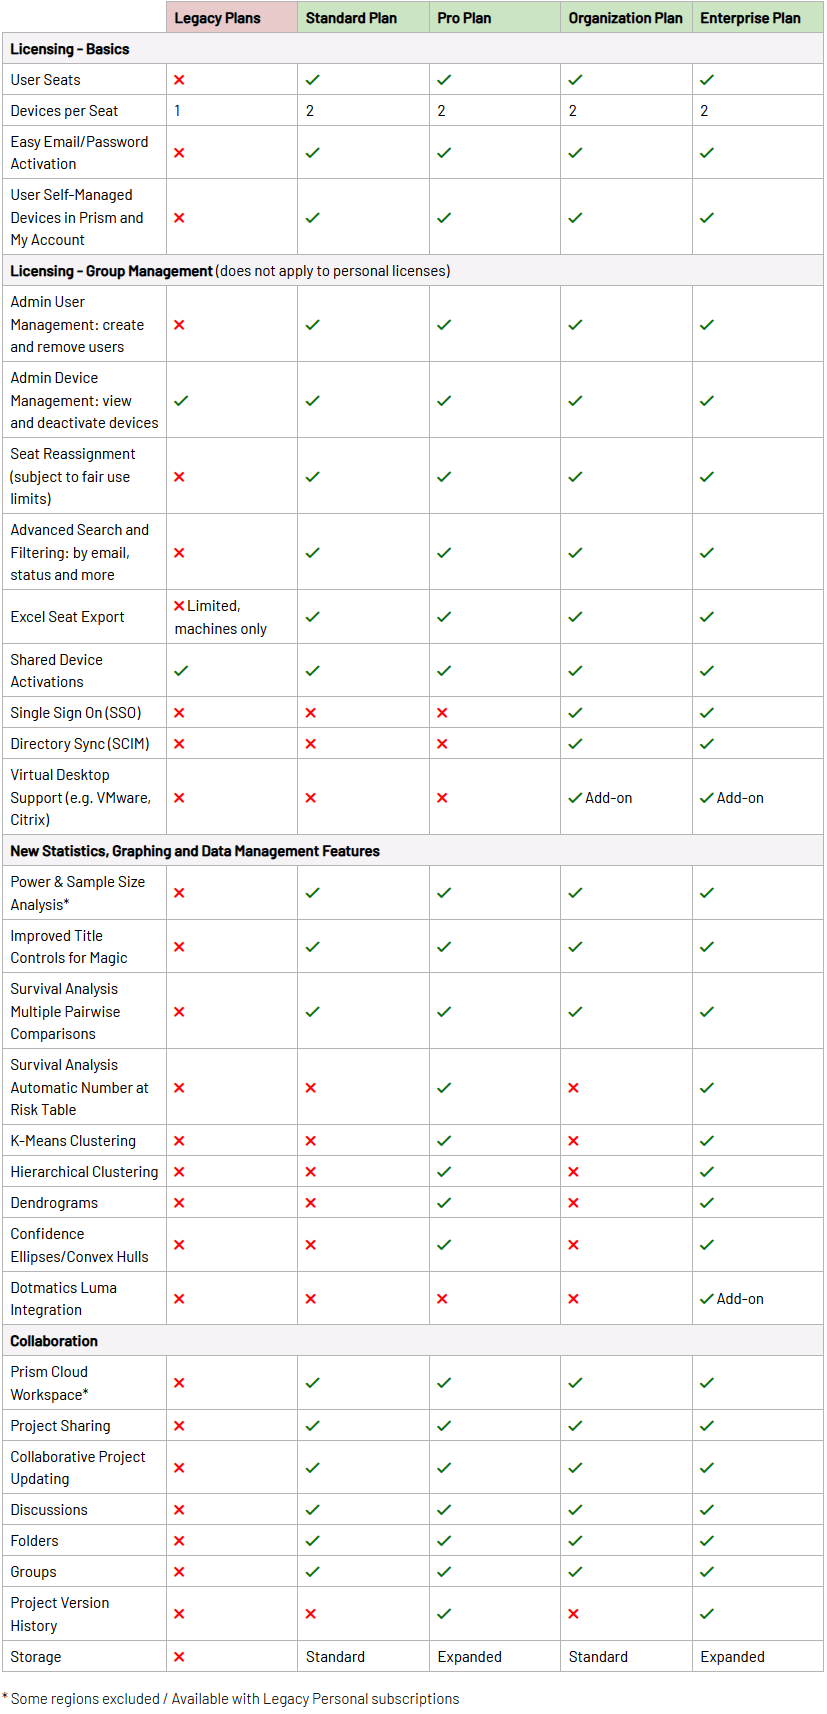
PRISM Plan Comparison
Our Standard plan is available in student, personal and group variants. Organization and Enterprise plans are only available for groups.
Le novità di Prism 11
Introducing an even more powerful Prism featuring enhanced data visualization and graph customization, more intuitive navigation, and more sophisticated statistical analyses.
How to Update to the latest Prism version 11
Subscribers
Update for free by downloading the installer for your system (instructions):
Windows | Mac
Perpetual Customers
Contact us at help.graphpad.com to learn about upgrade options.
Enhanced Data Visualization and Graphs Customization
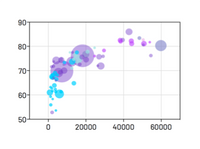
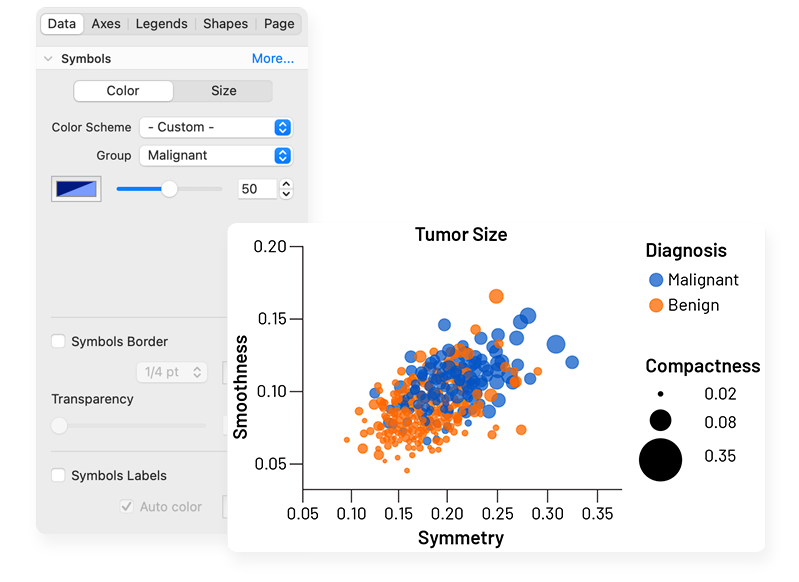
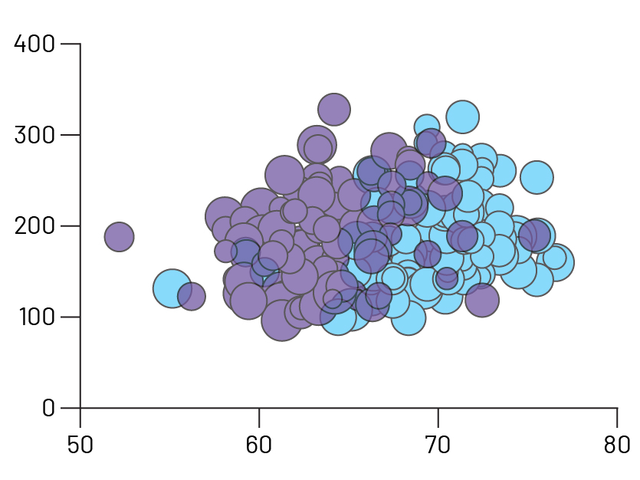
Bubble Plots
Create Bubble Plots directly from raw data, encoding variables for position (X- and Y-coordinates), color, and size.
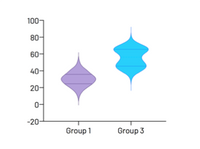
Violin plots
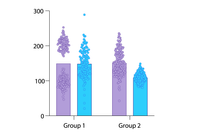
Visualize distributions of large data sets with either extended or truncated violin plots.
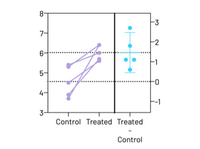
Estimation Plots
Automatically display your analysis results.
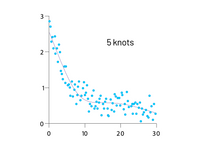
Smoothing spline
Major improvements in showing general data trends through Akima splines and smoothing splines with improved control over the number of knots, or inflection points.
Improved Graphing and Customization Options
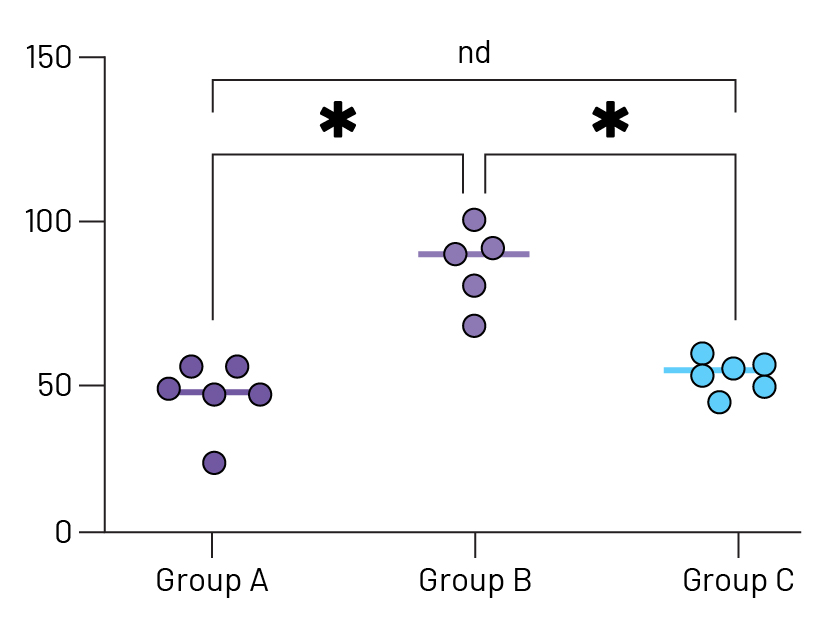
Stars on Graph
Automatically add multiple comparison results to graphs. Choose from a variety of P value summary styles including a responsive method appropriate for any alpha level.
Improved Graph Customization
Craft stunning Bubble plots faster, easier, and more intuitively than before. Interact and customize graphs from your Multiple Variables data in real-time.
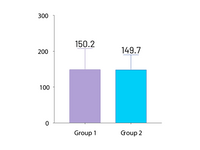
Automatically label bar graphs
Annotate your bar graphs with values for the means, medians, or sample sizes to emphasize what’s important in your work.
Improved grouped graphs
Easily create graphs that show both individual points (scatter) along with bars for mean (or median) and error bars.
More Effective and Efficient Research
Greater Collaboration
Use Prism Cloud to avoid those messy email threads. Keep all of your discussions in one place while securely controlling who has access to your work.
A More Open Access File Format
By using industry-standard formats (CSV, PNG, JSON, etc.), you can ensure that your projects can be utilized outside of Prism and open up new possibilities for your data workflows and integrations.
Expanded Data Table Capabilities
You can have as many windows open as you need and data in up to 2048 columns, with 512 sub columns in each. Expanded analysis constant dialog allows you to link to more results for all types of analyses.
Intelligent Data Wrangling
A new range of tools to help you prepare your Multiple Variables data for analysis. Transform data with spreadsheet-style formulas directly in the data table. Select specific data subsets using flexible criteria – by column, row range, or conditional rules. Or restructure data into one of Prism’s other data table formats with full control over how variables map to the new structure.
Hook Constant Dialog Upgrade
A convenient way to establish connections between different elements in Prism. A new easy-to-navigate tree structure now covers the entire library of Prism analyses.
Featuring Eight Kind of Data Tables
XY tables
Used when every data point is defined by a single X and Y value. These sorts of data are often fit with linear or nonlinear regression models.
Column tables
Used for data organized into groups by a single grouping variable (for example Treatment vs. Control or Female vs. Male). Often analyzed using t tests and one-way ANOVA.
Grouped tables
Used for data organized into groups by two grouping variables (for example Female Control vs. Female Treatment vs. Male Control vs. Male Treatment). Often analyzed using two-way ANOVA.
Contingency tables
Used for count data organized into groups by two grouping variables (Treatment vs. Control and Positive vs. Negative Outcome). Appropriate for analysis by Chi-square and Fisher’s exact test.
Survival tables
Used to perform Kaplan-Meier survival analysis. Each row represents a subject or individual with elapsed survival time and outcome.
Parts of whole tables
Used when it makes sense to ask: “What fraction of the total is each value in the table?”. Used for calculating fractions and generating pie charts.
Multiple variables tables
Used when each row is an observation and each column is a variable. Supports both numeric and text values. Transform data with spreadsheet-style formulas directly in the table. Perform multiple linear regression, Cox regression, t-tests, nonlinear regression, survival analysis, and multifactor (N-way) ANOVA.
Nested tables
Used when the data are organized into hierarchical groups. Analyzed using nested t tests or nested one-way ANOVA.
More Sophisticated Statistical Analyses
Perform repeated measures ANOVA – even with missing data
Now Prism will automatically fit a mixed effects model to complete this analysis.
Multifactor (N-way) ANOVA
Analyze experimental designs with any number of categorical grouping factors – from one-way ANOVA all the way up to N-way ANOVA. The Multiple Variables data table provides flexibility for data of any size and complexity, while drag-and-drop variable assignment makes analysis configuration simple and intuitive.
Perform simple and multiple logistic regression
Fit a model to a binary outcome (yes/no, win/lose, pass/fail) based on one predictor variable (simple logistic regression) or many predictor variables (multiple logistic regression).
Principal Component Analysis (PCA)
Calculate and select the principal components that describe the greatest amount of variance in your data. Choose from selection techniques including Parallel Analysis via Monte Carlo simulation, Eigenvalue threshold, Proportion of Variance threshold, and more.
Multiple t test (and nonparametric) analyses
Perform multiple independent two-sample comparison tests simultaneously. Select from parametric/nonparametric tests, and specify if data are unpaired/paired.
Analyze categorical variables with text in Multiple Linear and Multiple Logistic Regression
No coding required! Prism will automatically encode categorical variables and perform the analysis. Specify a reference and organize all levels of categorical variables in a model for clear, readable results.
Interpolation from multiple linear and multiple logistic regression
Use the specified model to predict values for the dependent variable based on data in the data table or using theoretical values specified in the analysis.
Funzionalità statistiche in Prism
Statistical Comparisons
- Paired or unpaired t tests. Reports P values and confidence intervals.
- Automatically generate volcano plot (difference vs. P value) from multiple t test analysis.
- Nonparametric Mann-Whitney test, including confidence interval of difference of medians.
- Kolmogorov-Smirnov test to compare two groups.
- Wilcoxon test with confidence interval of median.
- Perform many t tests at once, using False Discovery Rate (or Bonferroni multiple comparisons) to choose which comparisons are discoveries to study further.
- Ordinary or repeated measures ANOVA followed by the Tukey, Newman-Keuls, Dunnett, Bonferroni or Holm-Sidak multiple comparison tests, the post-test for trend, or Fisher’s Least Significant tests.
- One-way ANOVA without assuming populations with equal standard deviations using Brown-Forsythe and Welch ANOVA, followed by appropriate comparisons tests (Games-Howell, Tamhane T2, Dunnett T3)
- Many multiple comparisons test are accompanied by confidence intervals and multiplicity adjusted P values.
- Greenhouse-Geisser correction so repeated measures one-, two-, and three-way ANOVA do not have to assume sphericity. When this is chosen, multiple comparison tests also do not assume sphericity.
- Kruskal-Wallis or Friedman nonparametric one-way ANOVA with Dunn’s post test.
- Fisher’s exact test or the chi-square test. Calculate the relative risk and odds ratio with confidence intervals.
- Two-way ANOVA, even with missing values with some post tests.
- Two-way ANOVA, with repeated measures in one or both factors. Tukey, Newman-Keuls, Dunnett, Bonferroni, Holm-Sidak, or Fisher’s LSD multiple comparisons testing main and simple effects.
- Three-way ANOVA (limited to two levels in two of the factors, and any number of levels in the third).
- Analysis of repeated measures data (one-, two-, and three-way) using a mixed effects model (similar to repeated measures ANOVA, but capable of handling missing data).
- Comparison of data from nested data tables using nested t test or nested one-way ANOVA (using mixed effects model).
- Multifactor ANOVA for any number of factors with comprehensive effect size reporting.
- Comprehensive reporting for ANOVA, contingency table analyses, and t tests – including effect sizes as well as confidence intervals.
Nonlinear Regression
- Fit one of our 105 built-in equations, or enter your own. Now including family of growth equations: exponential growth, exponential plateau, Gompertz, logistic, and beta (growth and then decay).
- Enter differential or implicit equations.
- Enter different equations for different data sets.
- Global nonlinear regression – share parameters between data sets.
- Robust nonlinear regression.
- Automatic outlier identification or elimination.
- Compare models using extra sum-of-squares F test or AICc
- Compare parameters between data sets.
- Apply constraints.
- Differentially weight points by several methods and assess how well your weighting method worked.
- Accept automatic initial estimated values or enter your own.
- Automatically graph curve over specified range of X values.
- Quantify precision of fits with SE or CI of parameters. Confidence intervals can be symmetrical (as is traditional) or asymmetrical (which is more accurate).
- Quantify symmetry of imprecision with Hougaard’s skewness.
- Plot confidence or prediction bands.
- Test normality of residuals.
- Runs or replicates test of adequacy of model.
- Report the covariance matrix or set of dependencies.
- Easily interpolate points from the best fit curve.
- Fit straight lines to two data sets and determine the intersection point and both slopes.
- Perform nonlinear regression from Multiple Variables tables with drag-and-drop assignment of independent (X), dependent (Y), and grouping variables.
Survival Analysis
- Kaplan-Meier survival analysis. Perform nonparametric survival analysis for different groups, and compare the estimated survival curves for each group with the log-rank test (including test for trend).
- Cox proportional hazards regression. Perform semi-parametric survival analysis that allows for the inclusion of additional continuous or categorical predictor variables (covariates). Automatically generate graphs of estimated survival curves for any set of predictor variable values.
- Perform survival analysis from Multiple Variables tables with flexible variable assignment.
Principal Component Analysis
- Component selection via Parallel Analysis (Monte Carlo simulation), Kaiser criterion (Eigenvalue threshold), Proportion of Variance threshold, and more.
- Automatically generated Scree Plots, Loading Plots, Biplots, and more.
- Use results in downstream applications like Principal Component Regression.
Multiple Variable Graphing
- Specify variables defining axis coordinates, color, and size.
- Create Bubble Plots.
Column Statistics
- Calculate descriptive statistics: min, max, quartiles, mean, SD, SEM, CI, CV, skewness, kurtosis.
- Mean or geometric mean with confidence intervals.
- Frequency distributions (bin to histogram), including cumulative histograms
- Normality testing by four methods (new: Anderson-Darling).
- Lognormality test and likelihood of sampling from normal (Gaussian) vs. lognormal distribution
- Create QQ Plot as part of normality testing.
- One sample t test or Wilcoxon test to compare the column mean (or median) with a theoretical value.
- Identify outliers using Grubbs or ROUT method.
- Analyze a stack of P values, using Bonferroni multiple comparisons or the FDR approach to identify “significant” findings or discoveries.
Simple Linear Regression and Correlation
- Calculate slope and intercept with confidence intervals.
- Force the regression line through a specified point.
- Fit to replicate Y values or mean Y.
- Test for departure from linearity with a runs test.
- Calculate and graph residuals in four different ways (including QQ plot).
- Compare slopes and intercepts of two or more regression lines.
- Interpolate new points along the standard curve.
- Pearson or Spearman (nonparametric) correlation.
Generalized Linear Models (GLMs)
- Generate models relating multiple independent variables to a single dependent variable using the new multiple variables data table.
- Multiple linear regression (when Y is continuous).
- Poisson regression (when Y is counts; 0, 1, 2, …).
- Logistic regression (when Y is binary; yes/no, pass/fail, etc.).
Clinical (Diagnostic) Lab Statistics
- Bland-Altman plots.
- Receiver operator characteristic (ROC) curves.
- Deming regression (type ll linear regression).
Simulations
- Simulate XY, Column or Contingency tables.
- Repeat analyses of simulated data as a Monte-Carlo analysis.
- Plot functions from equations you select or enter and parameter values you choose.
Other Calculations
- Area under the curve, with confidence interval.
- Transform data.
- Normalize.
- Identify outliers.
- Normality tests.
- Transpose tables.
- Subtract baseline (and combine columns).
- Compute each value as a fraction of its row, column or grand total.
Calculated Variables from In-table Formulas
- Create calculated variables with spreadsheet-style formulas directly in Multiple Variables tables. Just type “=” to begin.
- Calculated variables update automatically when source values change.
- Created variables can be used as independent, dependent, or grouped variables in analysis that work with Multiple Variables tables.
Requisiti di Sistema di Prism
Prism non ha particolari requisiti e funzionerà bene su qualsiasi computer acquistato negli ultimi anni.
Ecco i dettagli:
Prims for Windows
- Operating System. Runs under the 64-bit versions of Windows 10 and 11. Prism 10 does not support 32-bit editions of Windows.
- CPU. x86-64 compatible. Note: Prism Windows is not currently offered in a version compiled to run natively on ARM chipsets (i.e. Qualcomm Snapdragon). However, Prism Windows can run on ARM-powered devices using x64 emulation which is now generally available with Windows 11
- RAM. For comfortable performance and responsiveness, Prism requires the following amount of RAM:
- 2 GB RAM for up to 2 million data cells in currently open Prism files
- 4 GB RAM for 2-8 million data cells
- 8 GB RAM for 8-16 million data cells
- 16 GB RAM for greater than 16 million cells
- Display. The minimum display resolution is 800 x 600, but the recommended display resolution for comfortable work is 1366 x 768.
- HDD. Requires about 100 MB (megabytes) of space on the hard drive.
- Internet. Prism must connect to the internet to verify the license when it is first activated. It will also attempt to connect upon every launch, and every 24 hours if the application is not closed. To continue operating, this connection must be successful once every 30 days (or 20 attempts, whichever comes sooner).
- Additional Information. Prism requires that the Microsoft Edge WebView2 rendering component be installed to correctly display pages in the Welcome Dialog. This is already installed by Microsoft on most new devices, but will be included with the Prism installation if it is missing.
Prims for Mac
- Operating System. Runs under macOS X 10.15 (Catalina) or later. If you use macOS 10.14, Prism will launch and seems to run OK, but we haven’t tested Prism thoroughly under this version of macOS and can’t provide much support. If you use 10.14, we urge you to update MacOS.
- CPU. Prism Mac is delivered as a Universal Binary and will run natively on both Apple silicon and Intel-based Mac computers.
- RAM. There is no particular requirement for RAM on Mac. Prism will run fine on all standard configurations of Macs manufactured by Apple.
- Display. Requires a display with a resolution of at least 1024 x 768 pixels.
- HDD. Requires about 130 MB (megabytes) of space on the hard drive..
- Internet. Prism must connect to the internet to verify the license when it is first activated. It will also attempt to connect upon every launch, and every 24 hours if the application is not closed. To continue operating, this connection must be successful once every 30 days (or 20 attempts, whichever comes sooner).