Qualità senza compromessi, conoscenza approfondita e eccellenza attraverso i processi di Business Intelligence e Data Analytics.
Statgraphics è il primo software statistico adattato per il PC, il primo che ha introdotto l’integrazione dei grafici all’interno di ogni procedura statistica, l’iniziatore degli strumenti di assistenza punto per punto e di altre innumerevoli caratteristiche innovative per semplificare i compiti quotidiani.
Mentre gli altri erano impegnati nel recupero, Statgraphics conduceva il gruppo nel fornire vantaggi pionieristici.
Statgraphics Technologies ha rilasciato Statgraphics Centurion 19 il completo software Windows per l’analisi statistica, la visualizzazione di dati e l’analisi predittiva.
L’intuitiva interfaccia, incomparabile in potenza e sofisticatezza, è abbinata alla semplicità di utilizzo e non richiede di imparare un complicato linguaggio a comandi.
Grazie alla capacità estesa di processare milioni di righe di dati (Big Data) e 290 procedure avanzate, Statgraphics 19 contiene tutto ciò di cui hai bisogno per avere successo. Il modello di business attuale richiede di affidarsi alla scienza dei dati per progredire.
E’ un dovere nei confronti del tuo business darà un’occhiata a ciò che Statgraphics Centurion 19 ti può offrire: 30 nuove procedure statistiche, un link per le funzionalità di Python, una moderna interfaccia grafica utente con una barra multifunzione agile e conveniente, un pannello delle procedure e altro ancora.
I miglioramenti enfatizzano la crescente importanza della visualizzazione dei dati, sia nel rivelare informazioni che spesso sono nascoste nei dati raccolti sia nella comprensione del significato dei metodi statistici applicati a quei dati.
Vuoi un assistente che ti guidi attraverso ogni fase delle tue analisi e riducano la curva di apprendimento? StatWizard e StatAdvisor sono al tuo servizio.
Adalta è Rivenditore Unico per l’Italia di Statgraphics Centurion. Richiesta quotazione…
Le novità e Miglioramenti nella versione 19.6.05
Nella nuova versione 19.6 sono state migliorate alcune funzionalità ed è stato aggiunto il nuovo Test di Vita Accelerata (ALT).
Scarica la Guida PDF al Accelerated-Life-Testing con Statgraphics.
Version 19.6.05 posted December 1, 2024

New features including:
- A new graphical user interface featuring a ribbon bar which makes it easy to find the analysis you want to use and the controls to select options.
- An interface to Python, with facilities for exchanging data, executing scripts, and accessing libraries such as the K-means clustering procedure.
- Over a dozen new statistical procedures, including equivalence analysis and noninferiority testing for variances, quantile regression, piecewise linear regression, zero-inflated Poisson and negative binomial regression, fitting mixtures of univariate and bivariate normal distributions, machine learning procedures such as decision forests, waterfall plots, and Venn and Euler diagrams.
- New alias optimal designs in the DOE Wizard, together with a feature for selecting optimal runs to enhance an existing design.
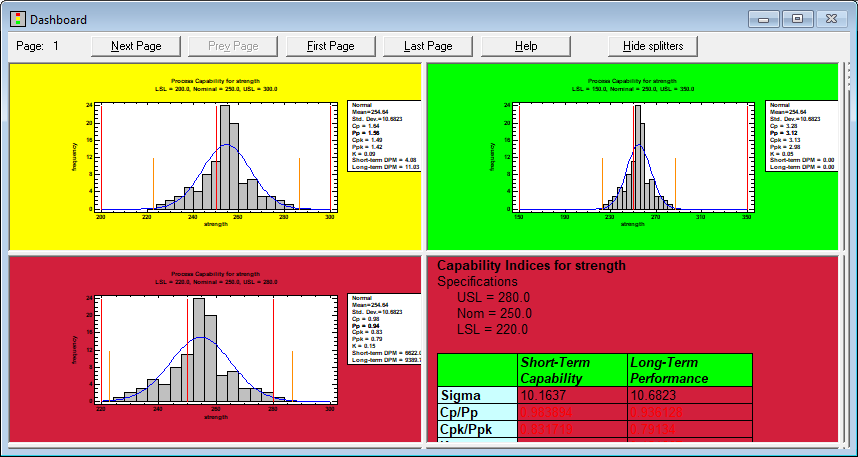
- A dashboard that indicates the status of selected procedures such as control charts and capability indices.
User Interface
Selection of options and procedures is now controlled by a ribbon bar and quick access toolbar.
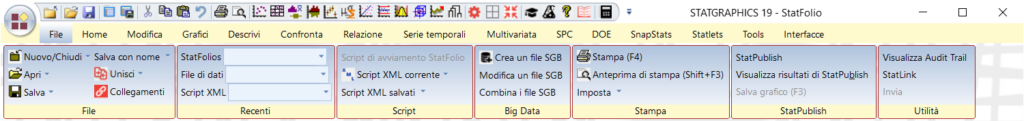
The ribbon bar makes it easy to find the feature you’re looking for, while the quick access toolbar lets you bypass the menus when using your favorite procedures.
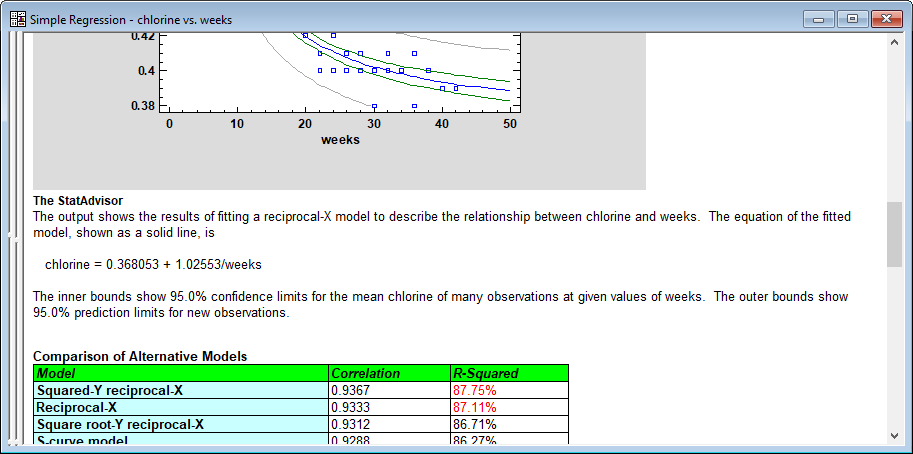
Analysis windows now let you switch between multi-pane and single pane modes. As in earlier versions, multi-pane mode puts each table and graph in a separate pane of a splitter window.
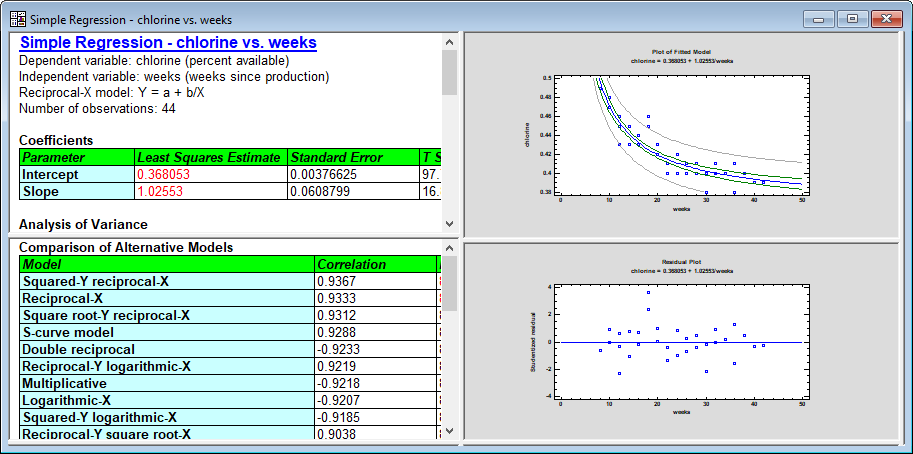
Single pane mode combines all output into a single report-style format.
As can be seen above, output tables now have modifiable column and row headers that may be displayed using selectable colors and other features.
Dashboard
A new Dashboard has been added to the set of StatFolio windows that can display tables and graphs from different analyses side-by-side. For procedures such as control charts, capability analyses, regressions, stock charts and measurement studies, the background of a table or graph can be colored green, yellow or red to indicate the status of selected indices, large changes or unusual residuals. Watch Video
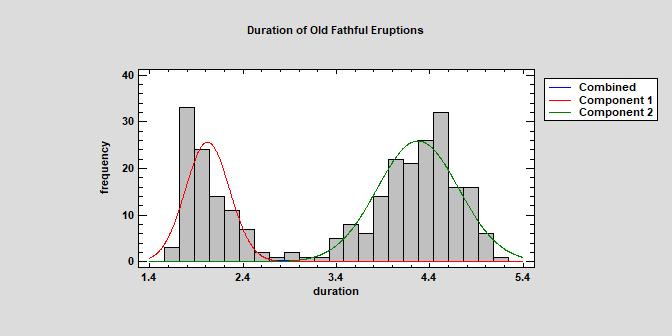
Univariate Mixture Distributions
The Distribution Fitting (Univariate Mixture Models) procedure fits a distribution to continuous numeric data that consists of a mixture of 2 or more univariate normal distributions. The components of the mixture may represent different groups in the sample used to fit the overall distribution, or the mixture model may approximate some distribution with a complicated shape. The procedure fits the distribution, creates graphs, and calculates tail areas and critical values. Tools are provided for determining how many components are needed to represent a data sample. Watch Video
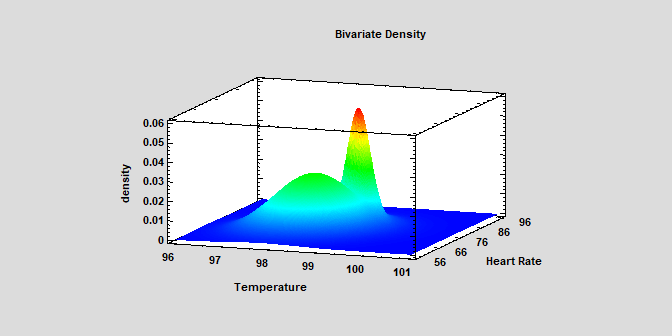
Bivariate Mixture Distributions
The Distribution Fitting (Bivariate Mixture Distributions) procedure fits a distribution to continuous numeric data that consists of a mixture of 2 or more bivariate normal distributions. The components of the mixture may represent different groups in the sample used to fit the overall distribution, or the mixture model may approximate some distribution with a complicated shape. The procedure fits the distribution and creates graphs of the fitted model. Tools are also provided for determining how many components are needed to represent a data sample. Watch Video
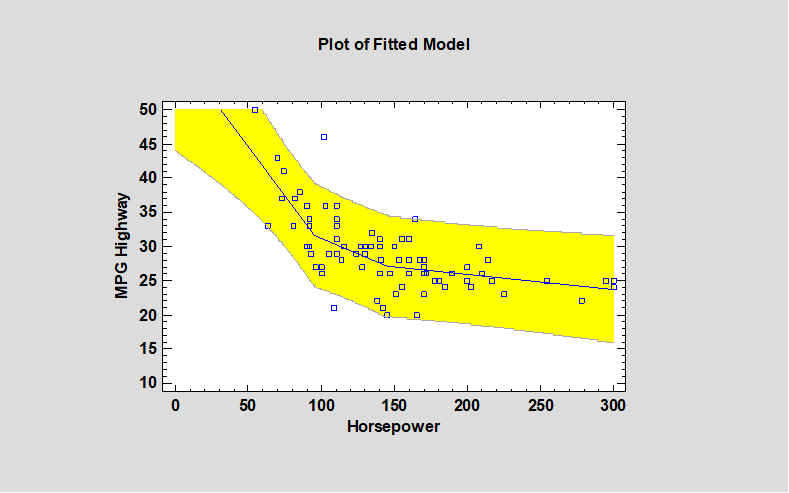
Piecewise Linear Regression
The Piecewise Linear Regression procedure is designed to fit a regression model where the relationship between the dependent variable Y and the independent variable X is a continuous function consisting of 2 or more linear segments. The function is estimated using nonlinear least squares. The user specifies the number of segments and initial estimates of the locations where the segments join. The procedure then estimates the slopes, slope changes, and the locations at which the s changes occur. Watch Video
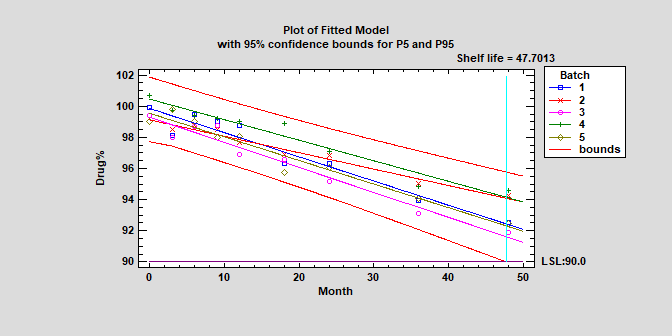
Stability Studies
Stability studies are commonly used by pharmaceutical companies to estimate the rate of drug degradation and to establish shelf life. Measurements are typically made on samples from multiple batches at different points in time. Of primary interest is estimating the time at which the lower prediction limit from the degradation model crosses the lower specification limit for the drug. Depending on the structure of the data, batches may be treated as either a fixed or random factor. Watch Video
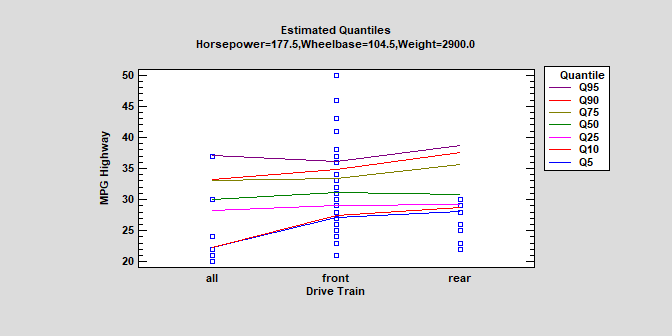
Quantile Regression
The Quantile Regression procedure fits linear models to describe the relationship between selected quantiles of a dependent variable Y and one or more independent variables. The independent variables may be either quantitative or categorical. Unlike standard multiple regression procedures in which the model is used to predict mean response, quantile regression models may be used to predict any percentile. Median regression is a special case where the quantile to be predicted is the 50th percentile. Watch Video
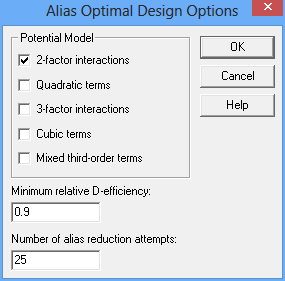
Alias Optimal Experimental Designs
New Alias-Optimal designs generated by the DOE Wizard consider not only the precision in the estimated model coefficients but also potential bias in those estimates caused by active effects that are not in the assumed model. Criteria such as D-optimality do not take into account aliasing caused by omitted effects. Sometimes, alternative D-optimal designs may be subject to considerably different amounts of aliasing. At other times, a small reduction in the efficiency of the selected design may result in a large reduction in potential bias. Watch Video
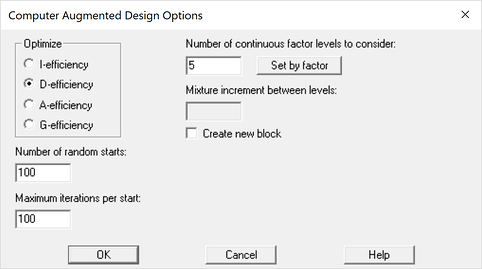
Optimal Augmentation of Existing Exp. Designs
A new feature added to the DOE Wizard is the ability to add runs to an existing experiment so as to maximize a selected optimality criterion. The user first selects the number of runs to be added and then completes the dialog box shown below. Watch Video
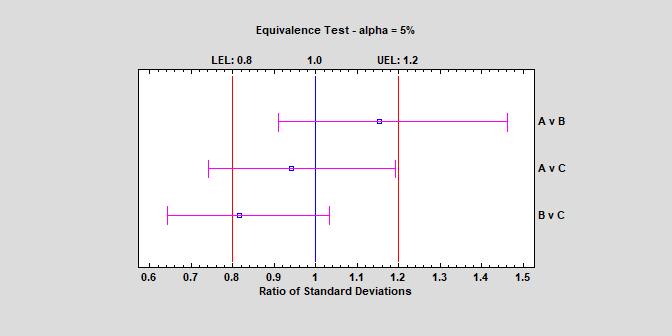
Equivalence Tests – Comparing Variances
New procedures have been added for demonstrating the equivalence or noninferiority of population variances. One procedure compares the variance of a single sample to a target value, while the other compares the variances of samples taken from 2 different populations. In the second case, the samples are considered to be “equivalent” if the ratio of their respective standard deviations falls within some specified interval surrounding 1. Watch Video
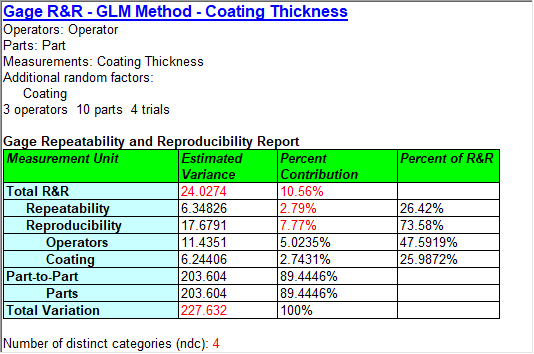
Gage Studies – GLM Method
The GLM Method estimates the repeatability and reproducibility of a measurement system based on a study in which m appraisers measure n items r times. It also estimates important quantities such as the total variation, the precision-to-tolerance ratio, the standard deviation of the measurement error, and the percent of study contribution from various error components. In addition to variation introduced by appraisers and parts, additional factors may also be included. The additional factors may be treated as having either fixed or random effects. Note: This procedure will handle unbalanced data. Watch Video
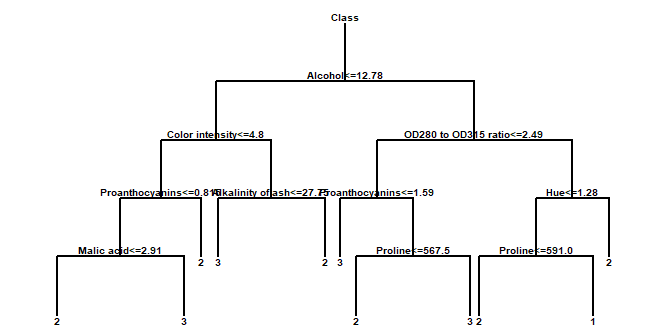
Decision Forests
The Decision Forests procedure implements a machine-learning process to predict observations from data. It creates models of 2 forms:
- Classification models that divide observations into groups based on their observed characteristics.
- Regression models that predict the value of a dependent variable.
The models are constructed by creating a large number of decision trees and averaging the predictions made from those trees. Many trees are constructed using a procedure similar to that of Classification and Regression Trees, with randomized node optimization and “bagging”. Watch Video
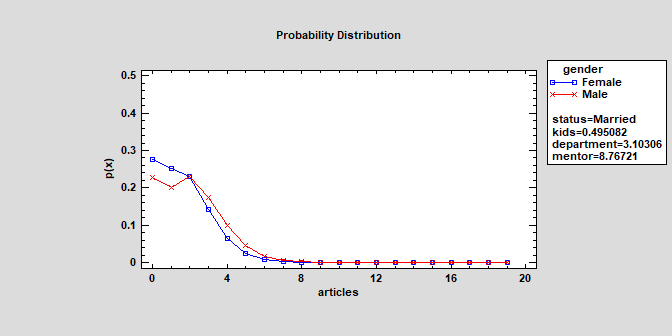
Zero-Inflated Count Regression
The Zero Inflated Count Regression procedure is designed to fit a regression model in which the dependent variable Y consists of counts. The fitted regression model relates Y to one or more predictor variables X, which may be either quantitative or categorical. It is similar to the procedures for Poisson Regression and Negative Binomial Regression except that it contains an additional component that represents the occurrence of more zeroes that would be expected in those models. Data containing excess zeroes is very common, including such diverse examples as the number of days a student is absent from school, the number of insurance claims within a population where not everyone has insurance, the number of defects in a manufactured item, and wild animal counts. Watch Video
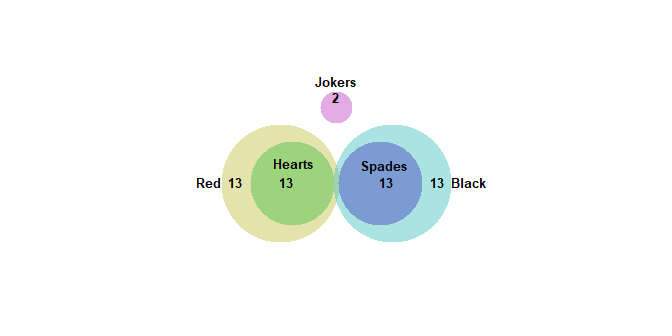
Venn and Euler Diagrams
The Venn and Euler Diagrams procedure creates diagrams that display the relative frequency of occurrence of discrete events. They consist of circular regions that represent the frequency of specific events, where the overlap of the circles indicates the simultaneous occurrence of more than one event. Watch Video
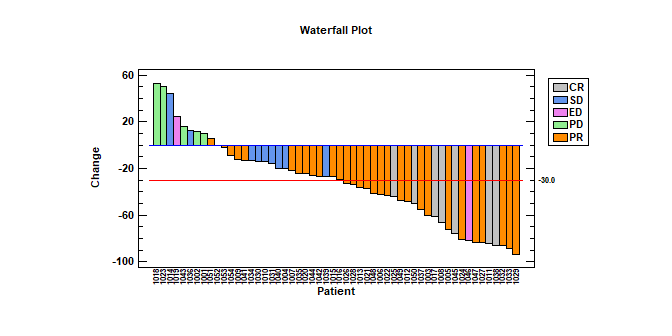
Waterfall Plots
3 types of waterfall plots have been added to version 19: an ordered plot, a sequential plot, and a 3-dimensional plot. Ordered Waterfall Plots are used to illustrate how a variable of interest increases or decreases amongst a sample of individuals. Data values are sorted and plotted as a barchart, usually with respect to a baseline equal to 0. A reference line may be added to the plot to display a target value. Watch Video
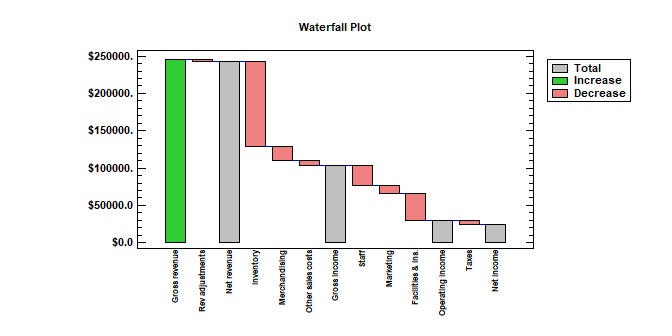
Sequential Waterfall Plots are used to illustrate the cumulative effect of positive and negative contributions to a total value. Bars are drawn representing each contribution as well as totals and subtotals. Applications include financial analysis, inventory analysis, performance analysis, hiring, and demographics.
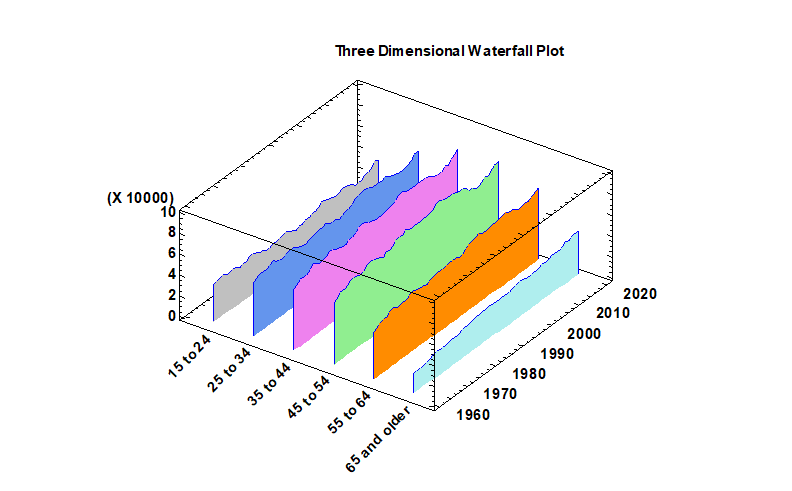
Three Dimensional Waterfall Plots are used to display multiple columns of data versus a common variable. One frequently encountered example is a Cumulative Spectral Decay plot, in which spectra are plotted at multiple times to illustrate changes in amplitude as a function of both frequency and time. In general, the plots are used to show changes in a quantitative variable versus both time and some other factor.
Python Interface
Version 19 adds an interface to the Python programming language that is similar to the interface to R that was added in Version 18. Procedures have been added that make it easy to pass data between Statgraphics and Python. Python scripts may also be written and executed from within Statgraphics. Watch Video
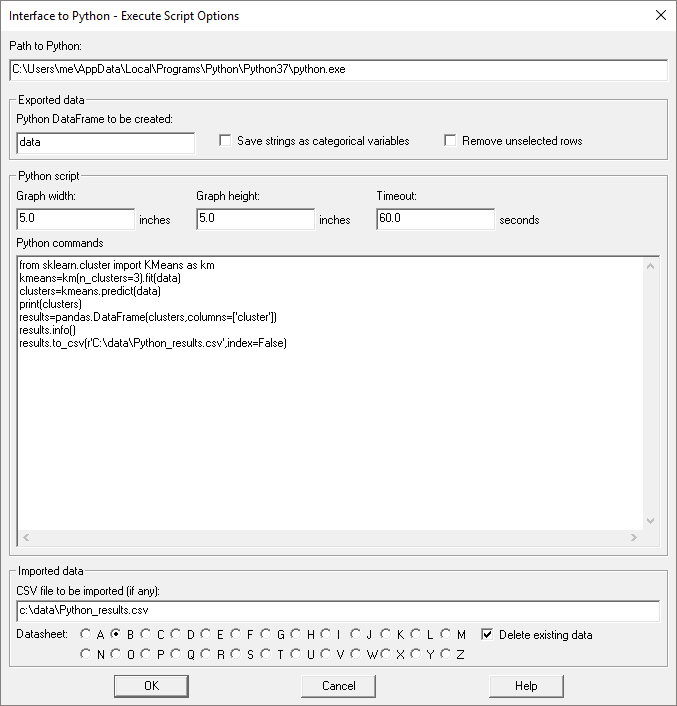
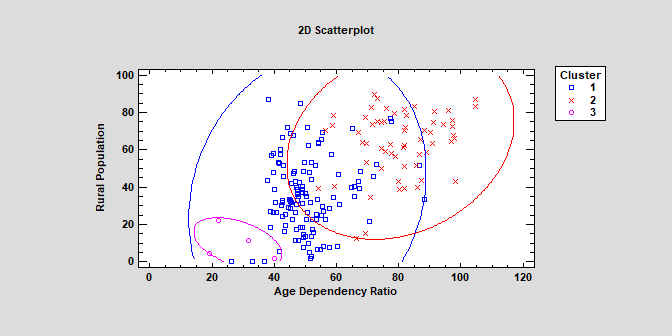
K-Means Clustering
The K-Means Clustering procedure implements a machine-learning process to create groups or clusters of multivariate quantitative variables. Clusters are created by grouping observations that are close together in the space of the input variables.The calculations are performed by the “Scikit-learn” module in Python. Watch Video
New Probability Distributions
Several new probability distributions have been added to the list of distributions available for fitting data and generating random numbers:
1. The zero-inflated Poisson distribution. Watch Video
2. The zero-inflated negative binomial distribution.
3. The Johnson family of SB, SL and SU distributions. Watch Video
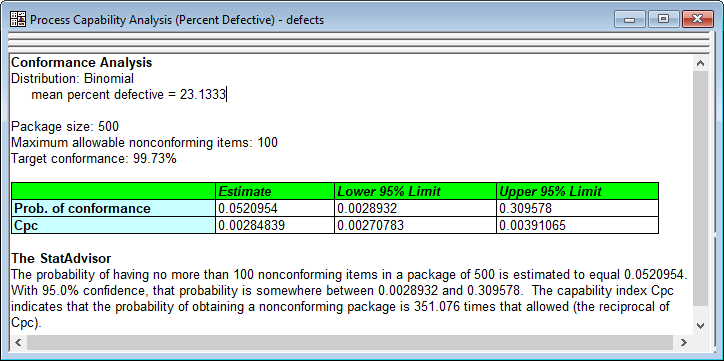
Conformance Analysis for Attribute Capability
Conformance analysis has been added to the procedures for determining capability based on attribute data. Conformance analysis is used to determine how well a process conforms to specifications stated in terms of the number of nonconforming items per package. Watch Video
New Statistical Tests
Several new statistical tests have been added to existing statistical procedures:
1. Levene’s test for comparing the variances of multiple samples.
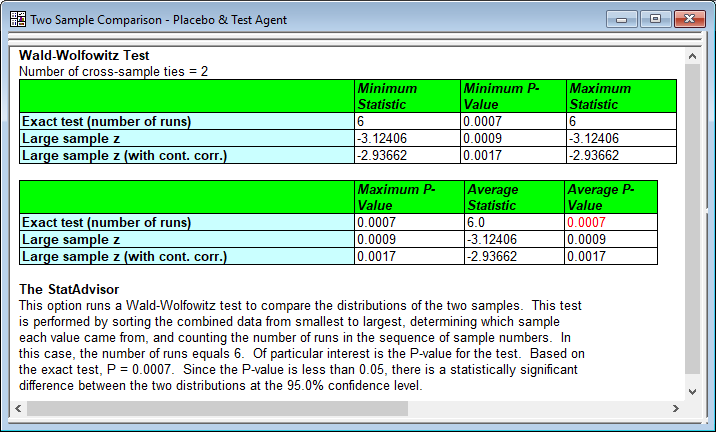
2. The Wald-Wolfowitz test, which tests the hypothesis that 2 independent samples come from the same population.
3. The Games-Howell Post-Hoc multiple comparisons test in the Oneway ANOVA procedure.
Statistical Process Control Charts
The number of recalculation points for the control limits has been changed from 4 to 9.
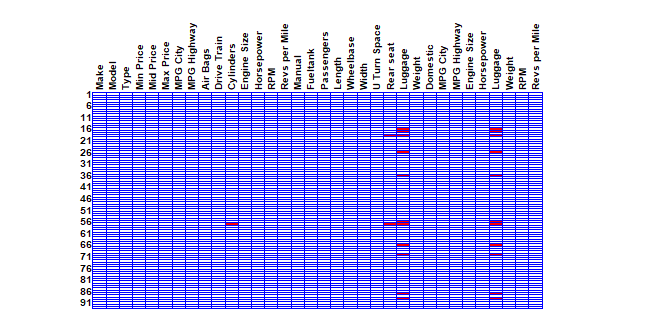
Missing Data Plot
A plot has been added to the Data Viewer to show the location of missing data in a data set.
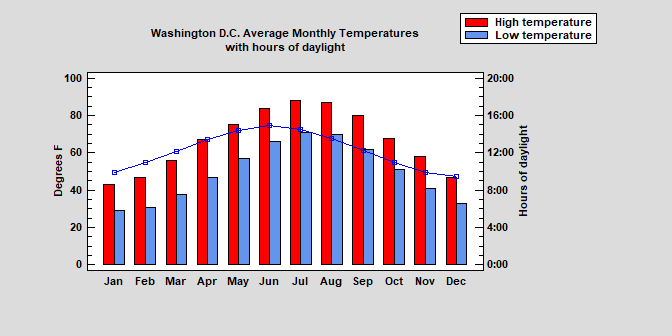
Barcharts
An optional line may now be added to simple and multiple barcharts. Watch Video
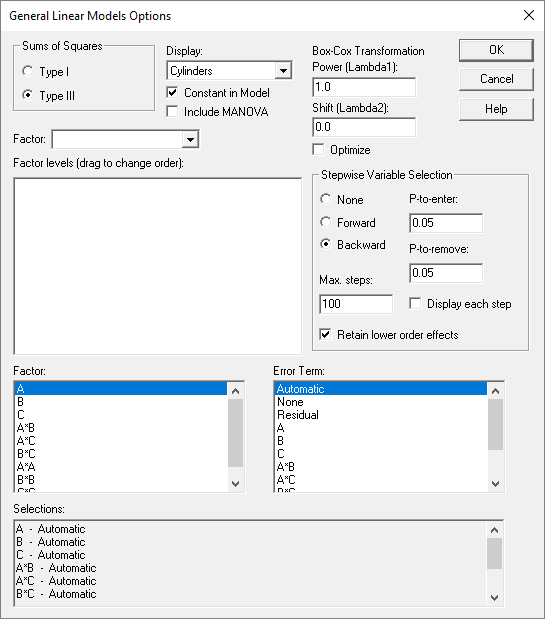
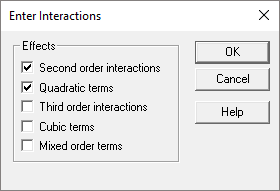
General Linear Models
Stepwise variable selection has been added to the GLM procedure for both quantitative and categorical factors. In addition, entry of interactions and other high-order terms has been simplified. Watch Video
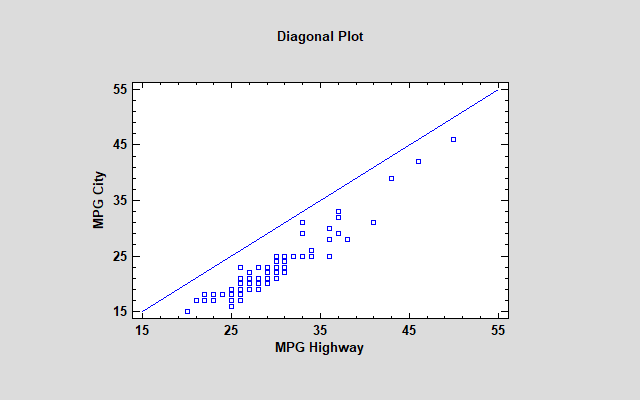
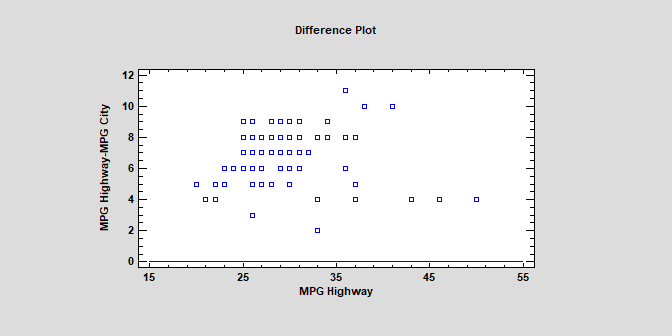
Paired Sample Comparisons
2 new diagnostic plots have been added to the Paired Sample Comparison procedure. The first is a Diagonal Plot that plots the paired values with a diagonal line.
Other Changes
New options have been added throughout the program.
- The ability to undo several consecutive operations in the data editor.
- The ability to reverse the order of the rows in a datasheet.
- The ability to save images contained in the StatGallery as image files.
- The ability to save graphs with a transparent background.
- The ability to change the point size when saving graphs.
- New one-sided prediction limits for Calibration Models.
- Optional lines separating clusters on a dendrogram.
- The ability to optimize only selected responses in the DOE Wizard.
- New residual probability plots in many procedures.
- Optional input of data and code columns in radar and spider plots.
- Direct data import from Minitab project files, SAS transport files, and SPSS portable files.
Strumenti di Statgraphics
Tra gli strumenti che rendono Statgraphics il software preferito dai tecnici del controllo qualità (e non solo) troviamo:
StatAdvisor
Ogni volta che Statgraphics produce dei risultati di un’analisi, lo StatAdvisor crea, in italiano o nella lingua scelta, una descrizione esplicativa con l’interpretazione dei risultati. Queste note possono essere copiate e incollate direttamente in altri documenti (ad esempio in una relazione scritta in MS Word). Questa funzionalità rende Statgraphics il programma preferito sia da utenti non statistici che vengono supportati nella lettura del risultato, sia da utenti esperti che evitano la noiosa parte dello spiegare un’analisi per i colleghi.
StatFolios
È lo strumento indispensabile per le operazioni ripetitive. Grazie ad esso è possibile salvare le analisi che si effettuano più frequentemente e rielaborarle ogni volta che si vuole.
StatGallery
Aggrega grafici e testi creati con differenti procedure in un’unica pagina per produrre un impaginato leggibile e accattivante.
StatLink
Grazie allo StatLink è possibile collegare un documento StatFolios a una o più fonti di dati in modo da poter effettuare analisi costantemente aggiornate.
Grazie all’opzione di esaminare automaticamente le fonti dati a un intervallo di tempo predefinito è possibile produrre automaticamente output aggiornati scadenziati.
Infine combinato con lo strumento StatPublish permette di programmare Statgraphics affinché aggiorni automaticamente l’output su un server web.
StatPublish
Permette di diffondere i risultati di un’analisi all’interno dell’intera organizzazione. È possibile creare un output HTML che può essere visualizzato da un qualsiasi web browser; è possibile, inoltre, automatizzare l’intera analisi e il processo di pubblicazione, creando uno script che può essere lanciato ogni giorno alla stessa ora.
StatWizard
È stato creato per assistere l’utente nel selezionare l’analisi più adatta per i propri dati. È sufficiente specificare le colonne che contengono i dati da analizzare e StatWizard farà il resto: suggerire l’analisi appropriata per quel tipo di dati, offrire di trasformare una o più delle variabili, aiutare a selezionare un subset dei dati se richiesto, ripetere l’analisi per ogni livello di una variabile “BY”. Dalla versione XVI anche la procedura DOE è stata semplificata tramite uno specifico Wizard.
SnapStats
Quando viene eseguita un’analisi statistica di base, questo strumento fornisce un metodo veloce per produrre un output preformattato in una singola pagina. È sufficiente inserire i nomi delle colonne che contengono i dati, premere invio e il risultato è fatto.
StatReporter
Nell’analisi dati è importante condividere i risultati con coloro che sono coinvolti nel processo decisionale. StatReporter è creato per aiutare nella preparazione di report di qualità all’interno di Statgraphics Centurion.
È possibile copiare all’interno di StatReporter, con un semplice click del mouse, ogni tabella o grafico creato all’interno del programma. È possibile inoltre collegare direttamente l’output alla fonte dati in modo che il report venga aggiornato automaticamente ogni volta che i dati cambiano.
Caratteristiche generali di Statgraphics Centurion
Analysis of Variance
An important technique for analyzing the effect of categorical factors on a response is to perform an Analysis of Variance. An ANOVA decomposes the variability in the response variable amongst the different factors. Depending upon the type of analysis, it may be important to determine: (a) which factors have a significant effect on the response, and/or (b) how much of the variability in the response variable is attributable to each factor.
Statgraphics Technologies products provide several procedures for performing an analysis of variance.
https://www.statgraphics.com/analysis-of-variance
Basic Statistical Methods
Statpoint Technologies products provide a wide range of procedures for accomplishing basic statistical tasks. This section describes some procedures in our basic statistics software for handling data sampled from one or more populations.
https://www.statgraphics.com/basic-statistical-methods
Categorical Data Analysis
Categorical data is data that classifies an observation as belonging to one or more categories. For example, an item might be judged as good or bad, or a response to a survey might includes categories such as agree, disagree, or no opinion. Statgraphics includes many procedures for dealing with such data, including modeling procedures contained in the sections on Analysis of Variance, Regression Analysis, and Statistical Process Control.
https://www.statgraphics.com/categorical-data-analysis
Data Mining & Machine Learning
Data Mining refers to a process by which patterns are extracted from data. Such patterns often provide insights into relationships that can be used to improve business decision making. Statistical data mining tools and techniques can be roughly grouped according to their use for clustering, classification, association, and prediction.
https://www.statgraphics.com/data-mining
Design of Experiments
STATGRAPHICS contains extensive capabilities for the creation and analysis of statistically designed experiments. Statgraphics functions as design of experiments software that creates designs of several types.
https://www.statgraphics.com/design-of-experiments
Exploratory Data Analysis
Exploratory Data Analysis refers to a set of techniques originally developed by John Tukey to display data in such a way that interesting features will become apparent. Unlike classical methods which usually begin with an assumed model for the data, EDA techniques are used to encourage the data to suggest models that might be appropriate.
Statpoint Technologies products provide many EDA techniques, scattered throughout the statistical procedures and some of the most important exploratory data analysis methods.
https://www.statgraphics.com/exploratory-data-analysis
Life Data Analysis & Reliability
Determining the reliability of manufactured items often requires performing a life test and analyzing observed times to failure. Such data is frequently censored, in that some items being tested may not have failed when the life data analysis test is ended. In addition, it may be necessary to accelerate failure times by changing the value of an influential variable such as temperature using failure analysis tools. For all of these reasons, special failure analysis tools are needed to deal with this type of data.
STATGRAPHICS provides several special procedures for using life data analysis software and dealing with failures times.
https://www.statgraphics.com/life-data-analysis-and-reliability
Measurement Systems Analysis (Gage Studies)
Measurement systems analysis (MSA) is an assessment of variation contributed by the measuring system. When implementing any statistical method that relies on data, it is important to be sure that the systems that collect that data are both accurate and precise. A set of procedures, often referred to as “Gage Studies”, are widely used to assess the quality of measurement systems. The following table shows the measurement systems analysis procedures in Statgraphics’ systems analysis software.
https://www.statgraphics.com/measurement-systems-analysis
Monte Carlo Simulation
Monte Carlo simulation is used to estimate the distribution of variables when it is impossible or impractical to determine that distribution theoretically. It is used in many areas, including engineering, finance, and DFSS (Design for Six Sigma). A typical Monte Carlo simulation includes: (1) One or more input variables X, some of which usually follow a probability distribution. (2) One or more output variables Y, whose distribution is desired. (3) A mathematical model coupling the X’s and the Y’s. Statgraphics also includes a wide array of random number generators for use in simulation models.
https://www.statgraphics.com/monte-carlo
Multivariate Methods
Multivariate statistical methods are used to analyze the joint behavior of more than one random variable. There are a wide range of mulitvariate techniques available, as may be seen from the different statistical method examples below. These techniques can be done using Statgraphics Centurion multivariate statistical analysis.
https://www.statgraphics.com/multivariate-methods
Nonparametric Methods
Non-parametric methods are used to analyze data when the distributional assumptions of more common procedures are not satisfied. For example, many statistical procedures assume that the underlying error distribution is Gaussian, hence the widespread use of means and standard deviations. When the error distribution is not known, non-parametric statistical tests may be safer to apply.
The non-parametric methods in Statgraphics are options within the same procedures that apply the classical tests. These non-parametric statistical methods are classified below according to their application.
https://www.statgraphics.com/nonparametric-methods
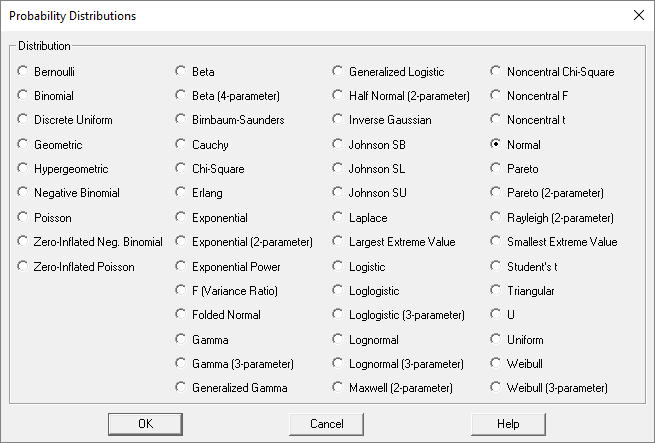
Probability Distributions
Statgraphics contains several procedures for manipulating statistical probability distributions. Each of more than 50 distributions may be plotted, fit to data, and used to calculate critical values or tail areas. Random samples may also be generated from each of the distributions with this stat software.
https://www.statgraphics.com/probability-distributions
Process Capability Analysis
Statgraphics contains several procedures for manipulating statistical probability distributions. Each of 45 distributions may be plotted, fit to data, and used to calculate critical values or tail areas. Random samples may also be generated from each of the distributions with this stat software.
https://www.statgraphics.com/process-capability-analysis
Regression Analysis
Regression analysis is used to model the relationship between a response variable and one or more predictor variables. STATGRAPHICS Centurion provides a large number of procedures for fitting different types of regression models.
https://www.statgraphics.com/regression-analysis
Sample Size Determination
Before collecting data, it is important to determine how many samples are needed to perform a reliable analysis. This requires finding an adequate sample size n so that the statistics to be estimated have a sufficiently small margin of error and that any statistical tests to be performed have the required power.
Statgraphics Technologies products provide several procedures for determining the required sample size in statistics procedures.
https://www.statgraphics.com/sample-size-determination
Six Sigma & Lean
Six Sigma analysis is a structured approach to business management that concentrates on improving quality by reducing process variability and eliminating major failure mechanisms. Since it relies heavily on the collection and analysis of data, statistical programs such as Statgraphics are a vital component of all serious Six Sigma implementations. Our Lean Six Sigma analytical tools add important concepts from lean manufacturing, which concentrates on the elimination of unnecessary resource utilization.
https://www.statgraphics.com/six-sigma-lean
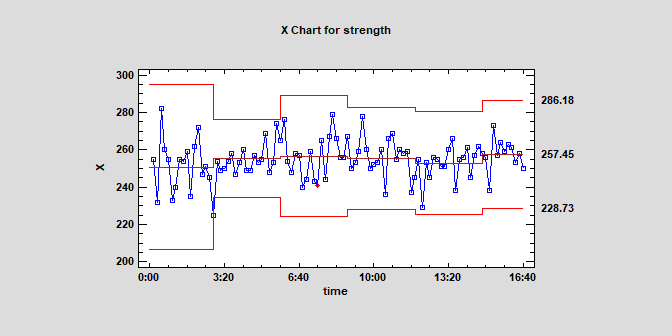
Statistical Process Control Charts
One of the most important actions that can help maintain the quality of any good or service is to collect relevant data consistently over time, plot it, and examine the plots carefully. All statistical process control charts plot data (or a statistic calculated from data) versus time, with control limits designed to alert the analyst to events beyond normal sampling variability.
Our STATGRAPHICS Centurion SPC software packages provide one of the most extensive collection of control charts available. All control charts can be used for Phase I studies, in which the data determine the location of the control limits, and Phase II studies, in which the data are compared against a pre-established standard. A special procedure is also provided to help design a control chart with acceptable power. E-mail alerts can be generated using our SPC software packages for when points fall outside the control limits or when a run rule is violated.
https://www.statgraphics.com/statistical-process-control-charts
Time Series Analysis & Forecasting
Many types of data are collected over time. Stock prices, sales volumes, interest rates, and quality measurements are typical examples. Because of the sequential nature of the data, special statistical techniques that account for the dynamic nature of the data are required. Statgraphics’ products provides several procedures for dealing with time series data:
https://www.statgraphics.com/time-series-analysis-and-forecasting
Visualization
Graphical methods are often the best way to extract the information available in data. There are many techniques available to visualize that information, depending on the nature of the data. Statgraphics contains a large set of visualization tools, many with built-in animation to show how data change over time.
https://www.statgraphics.com/visualization
Metodo SixSigma in Statgraphics
Because of the widespread use of Statgraphics in Six Sigma programs, users of the Professional Edition may choose instead to use a special Six Sigma menu. This menu organizes the procedures into the Six Sigma DMAIC categories, plus a couple of additional categories with advanced tools.
Define
Quality Function Deployment
Cost of Quality Trend Analysis
Cause-and-Effect Diagrams
Process Maps
Measure
Scatterplots
Exploratory Plots
Time Sequence Plots
Gage Studies for Variables and Attributes
Sample Size Determination
Analyze
One Variable AnalysisCapability Analysis for Variables
Capability Analysis for Attributes
Multivariate Capability Analysis
Distribution Fitting+
Two Sample Comparisons
Multiple Sample Comparisons
Comparison of Rates and Proportions
Outlier Identification
Multivariate Methods
Reliability and Life Data Analysis
Improve
Regression Analysis for Measurement Data
Regression Analysis for Attribute Data
Life Data Regression
Analysis of Variance
Design of Experiments
Screening, Response Surface, and Mixture Designs
D-Optimal Designs
Inner and Outer Arrays
Designs for Categorical Variables
Multiple Response Optimization
Control
Phase II Control Charts
Multivariate Control Charts
Acceptance Sampling
Classification Methods
Forecast
Descriptive Time Series Methods
Smoothing
Seasonal Decomposition
Forecasting
SnapStats
One Sample Analysis
Two Sample Comparison
Paired Sample Comparison
Multiple Sample Comparison
Curve Fitting
Capability Assessment (Individuals)
Capability Assessment (Grouped Data)
Gage R&R
Automatic Forecasting
Tools
Expression Evaluator
Six Sigma Calculator
Probability Distributions
Interpolation
Surface and Contour Plots
Custom Charts
Lingue disponibili per Statgraphics Centurion
Statgraphics Centurion è disponibile in 5 lingue:
Italiano
Inglese (Americano)
Francese
Tedesco
Spagnolo
E’ possibile acquistare Statgraphics in versione:
Monolingua (1 lingua a scelta)
Bilingua (2 lingue a scelta)
Multilingua (tutte e 5 le lingue)
Le edizioni Monolingua, Bilingua o Multilingua di Statgraphics Centurion hanno le stesse caratteristiche e contengono le medesime procedure statistiche.
Acquistando una versione con più lingue il programma permette di scegliere una lingua di utilizzo del software (lingua dei menu) e una seconda lingua per tutti i testi dei grafici e dei commenti alle analisi (lingua degli output). Inoltre, gli output possono essere creati in una lingua e essere tradotti “al volo” cambiando semplicemente la lingua scelta nelle preferenze.
Moltissimi utenti apprezzano la facilità con cui è possibile produrre documenti testuali dove l’analisi è spiegata tecnicamente nella lingua desiderata.
Che siate un Tecnico di una muntinazionale che deve far circolare tra i colleghi esteri un report, o siate un Docente che deve pubblicare su una rivista scientifica straniera, Statgraphics Bilingua o Multilingua è il software che vi aiuterà nella distribuzione dei contenuti in tutto il mondo!
Statgraphics Licenza Studente
Statgraphics è disponibile anche nella speciale licenza dedicata agli studenti acquistabile solo esclusivamente direttamente dal produttore.
Caratteristiche licenza Studenti
- Tempo limitato (6 o 12 mesi dalla data di acquisto).
- L’intestatario deve essere iscritto a un’istituzione che concede una Laurea e presentare una prova dello stato di studente.
- I PhD student sono autorizzati ad acquistare la licenza per studenti; dopo l’acquisizione del titolo PhD decade l’autorizzazione e sarà necessario acquistare una licenza Academic rivolta a Docenti e Ricercatori.
- Installazione su un solo (1) computer di proprietà dello studente, non su un computer di proprietà dell’Università/Politecnico.
- La licenza è personale e non cedibile e deve essere acquistata e intestata a nome dell’utente studente.
In fase di acquisto è necessario fornire oltre che i dati personali dell’utente intestatario (nome, cognome, email), anche copia di un documento che attesti la qualifica di studente (Badge ID Studente o Libretto Universitario). - Supporto tecnico fornito solo direttamente dal produttore Statgraphics, in inglese, e solo per la fase di attivazione della licenza (activate@statgraphics.com).
Requisiti di sistema di Statgraphics
Windows XP, Vista, 7, 8, 10 or later
- 64-bit systems: 4 GB or more recommended
- 320 MB or greater of available disk storage
- Access to Internet
Editions
- 64-bit
- English, Italian, French, German, Spanish
NOTE: Installazione su Windows Vista
Per installare correttamente Statgraphics su un PC con Windows Vista è sufficiente:
- Accedere al computer come Amministratore del sistema
- Avviare il programma
- Effettuare la registrazione utilizzando il codice di attivazione ricevuto
Dopo la registrazione, non sarà più necessario accedere come Amministratore, e sarà possibile accedere con il solito account utente standard.