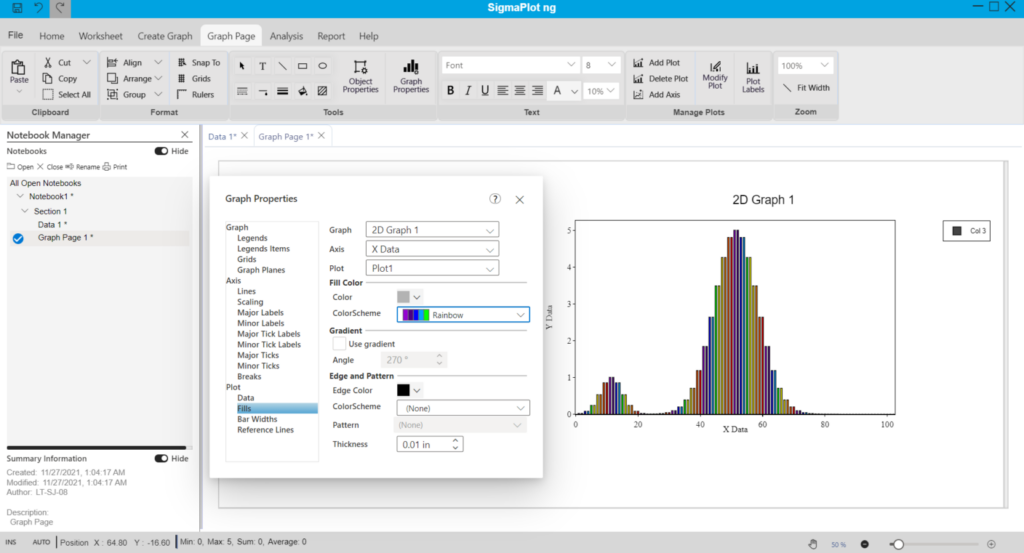
Sulla base della struttura di SigmaPlotng esistente, siamo lieti di annunciare il lancio di SigmaPlotng Foundation, progettato specificamente per soddisfare le esigenze della comunità studentesca.
Adalta è Rivenditore Unico per l’Italia di Grafiti SigmaPlot NG Foundation. Richiesta quotazione…
Panoramica su SigmaPlot NG Foundation
SigmaPlot ng Foundation is our first ever cross platform tool, which allows our users the flexibility to use SigmaPlot ng Foundation on multiple OS or devices. It is built on a cloud first framework, enabling us to deliver common experience across all platforms. Though SigmaPlot ng Foundation caters to a wider audience, it has been developed essentially to address the rising needs of the student community. Data Analysis and Graphing provide an invaluable aid in solving arithmetic and algebraic problems and representing relationships among variables, display mathematical relationships that often cannot be easily recognized in numerical form, students as young as 12 can learn skills that are essential not only at University but also at their chosen career path. SigmaPlot ng Foundation is intended to be a learning tool and can be deployed in any size class room. Although SigmaPlot ng Foundation preserves SigmaPlot’s primary function of visualizing statistical data its simplified to suit the needs of the student community, making it a very powerful tool for all students.
SigmaPlotng is built considering the growing needs of our customers to handle complex data. With it’s modular architecture SigmaPlot ng offers enhanced flexibility and ease of use.

Caratteristiche principali di SigmaPlotng Foundation
GraphTypes
2D Types
- Scatter (11Types), Line (12 Types), Scatter and Line (15 Types)
- Vertical and Horizontal Bar (4 Types), Grouped Bar (4 Types)
- Vertical Stacked Bar
- Area Plots (4 Types)
- Radar (4 Types)
- Box (2 Types)
- Polar (3 Types)
- Contour, line and filled (2 Types)
- Histogram
- Ternary (3 Types)
- Bubble, Pie
- Heat Map
- Geographical Maps
3D Types
- Scatter,
- Line – Trajectory
- Mesh
- Waterfall
Statistical tests
- Descriptive statistics
- One Way Frequency Tables
- One Sample t-test
- One Sample Signed Rank test
- t-tests, Rank Sum Test
- One-way, two-way, three-way ANOVA
- ANOVA on Ranks
- One Way Analysis of Covariance (ANCOVA)
- Paired T-Test
- Signed Rank Test
- One Way, Two Way Repeated measures ANOVA
- Repeated measures ANOVA on Ranks
- Z-test, chi-square, Fisher Exact Test, McNemar’s Test, Relative Risk, Odds Ratio
- Linear, Stepwise, Best Subset, Polynomial, Multiple Logistic, Multiple Linear, Deming
- Principal Components Analysis (PCA)
- Correlation -> Pearson Product Moment, Spearman Rank Order
- Survival analysis (Kaplan-Meir – Single Group, Log Rank, Gehan Breslow)
- Survival analysis (Cox Regression – Proportional Hazard, Stratified Model)
- Normality
Transform
- Quick Transform
- User Defined Transform
- Statistical Transform
Statistical Advisor
- Advisor Wizard guides through the process of choosing the appropriate statistical test
Statistical Report
- Ability to change the report background color
- Insert tables with pre-defined styles or customize completely
- Zoom enabled report
- Bookmarks/Table of contents: User should be able to create bookmarks, by specifying portions of texts as reference/placeholder.
- Page header/Footer/page number: User should be able to add header/footer and page number at the bottom of the page.
- Page Setup: User should be able to specify the page configuration, page layout, margins and size.
- Page Break: User should be able to insert page breaks.
- Insert footnotes/endnotes: User should be able to add footnotes and endnotes to the document editor.
- Background Images – User should be able to insert images as Backgrounds/Watermarks.
- Property panel – context editing: User should be able to use the property panel based on the Report feature selected (Property Panel for text will be different from tables)
Statistical Result Graph
- Result graphs for appropriate statistical test result.
Data Worksheet
- Formula bar- Edit/enter the cell values through a formula bar directly.
- Formulas- To apply formula to the cells.
- Insert color, symbols and line styles
- Cell display formats
- Format content of the cells
Data Worksheet Import
- Directly import SAS data sets (.sd2 and .sas7bdat files)
- Directly import Minitab data sets (.mtw & .mpj files)
- Open ASCII Plain, CSV and general import filter like Excel(.xls, .xlsx)
- Import any ODBC compliant database
- Run SQLqueries on tables and selectively import information
- Opens R, Statistica, Matlab, Stata, JMP files
- JDBC support to (Addition to ODBC) Import database
Data Worksheet Export
- SAS files (.sd2 files)
- Minitab files (.mtw & .mpj files)
- ASCII Text, Tabbed, Comma, Excel, DIF,
- PDF, PSD and HTMLexport of graphs and reports
- R, Statistica, Matlab, Stata, JMP files
Requisiti di sistema di SigmaPlotng Foundation
Windows: Windows 10, Windows 11
Mac OS: Big Sur, Monterey
Hardware requirements:
Mac:
- 8 GHz or faster 64-bit processor; Dual-core or better recommended.
- Both Intel (x64) and Apple Silicon (arm64) processors are supported.
- 4 GB of RAM; 8 GB of RAM recommended.
- Hard disk space: Minimum of 1 GB up to 2 GB of available space.
- A screen resolution of 1280 x 800 or higher.
Windows:
- 8 GHz or faster 64-bit processor; Dual-core or better recommended.
- 4 GB of RAM; 8 GB of RAM recommended.
- Hard disk space: Minimum of 1 GB up to 2 GB of available space.
- A screen resolution of 1280 x 800 or higher.
Additional Requirements:
- Administrator rights required to install Sigmaplot ng Foundation 1.0.